Want to supercharge your AWS monitoring? Here's how to nail the AWS-LogicMonitor integration:
- Set up accounts correctly
- Collect data efficiently
- Use CloudWatch features
- Set up good alerts
- Use LogicMonitor's AWS tools
- Manage AWS resources in LogicMonitor
- Improve performance and lower costs
Quick Comparison:
| Best Practice | Key Benefit |
|---|---|
| Correct account setup | Secure, smooth integration |
| Efficient data collection | Focused, relevant monitoring |
| CloudWatch features | Extended data retention, combined metrics |
| Good alerts | Timely, actionable notifications |
| LogicMonitor AWS tools | Automated resource discovery, custom dashboards |
| Resource management | Organized, easily navigable AWS assets |
| Performance and cost optimization | Better AWS performance, lower bills |
These practices help you get a clear view of your AWS setup, catch issues fast, and save money. Let's dive in and see how to make it happen.
Related video from YouTube
1. Set up accounts correctly
Setting up AWS and LogicMonitor accounts is crucial for smooth integration. Here's what you need to do:
Create IAM roles and policies

- Open the IAM section in your AWS Management Console
- Create a new IAM policy using LogicMonitor's JSON
- Make an IAM role and attach this policy
- Use LogicMonitor's Account ID and External ID for the trust relationship
Get permissions right
Permissions are key. Here's the deal:
- Stick to the minimum permissions needed
- 's3:GetObjects' is a must for billing monitoring
- Start with AWS's 'ReadOnlyAccess' policy if you're unsure
| Permission | What it's for |
|---|---|
| s3:GetObjects | Billing monitoring |
| cloudwatch:ListMetrics | List CloudWatch metrics |
| ec2:DescribeInstances | Describe EC2 instances |
| rds:DescribeDBInstances | Describe RDS instances |
These are just examples. Your needs might be different.
"The principle of least privilege is key in information security. LogicMonitor's Role-Based Access Control system lets you apply this easily", - LogicMonitor docs
Remember: Only give the permissions you absolutely need. It's safer that way.
2. Collect data efficiently
Collecting data efficiently is crucial when integrating AWS with LogicMonitor. Here's how to do it:
Choose which services to monitor
Don't monitor everything. Pick the AWS services that matter most to your business. LogicMonitor supports over 70 AWS services, so be picky.
Focus on:
- Services that keep your business running
- Components with lots of traffic
- Resources that cost you the most
Running a web app? You might want to watch:
- EC2 for compute
- RDS for databases
- S3 for storage
- CloudFront for content delivery
Adjust data collection timing
Balance accuracy and performance by setting the right collection intervals:
| Service Type | Recommended Interval |
|---|---|
| Core services (EC2, RDS) | Every 5 minutes |
| Less critical services | Every 15-30 minutes |
| Auto Scaling groups | Every 10 minutes |
For Amazon EC2 Auto Scaling, LogicMonitor says:
"Select 'Every 10 Minutes' from the NetScan Frequency option to enable LogicMonitor to check for new EC2 instances more frequently."
This helps you keep up with resource changes without overloading your system.
Tips for efficient data collection
- Use LogicMonitor's Amazon SDK to measure app performance from your servers' view.
- Let LogicMonitor automatically find all your AWS services.
- Pull business-level metrics from services like DynamoDB for targeted monitoring.
Need specific metrics? You can customize CloudWatch DataSources. Here's how to monitor SSL Handshake Time for Route53:
- Clone an existing datapoint in the AWS_Route53 DataSource
- Change the metric path to:
AWS/Route53>HealthCheckId:##system.aws.resourceId##>Region:##system.aws.region##>SSLHandshakeTime>Average
3. Use CloudWatch features
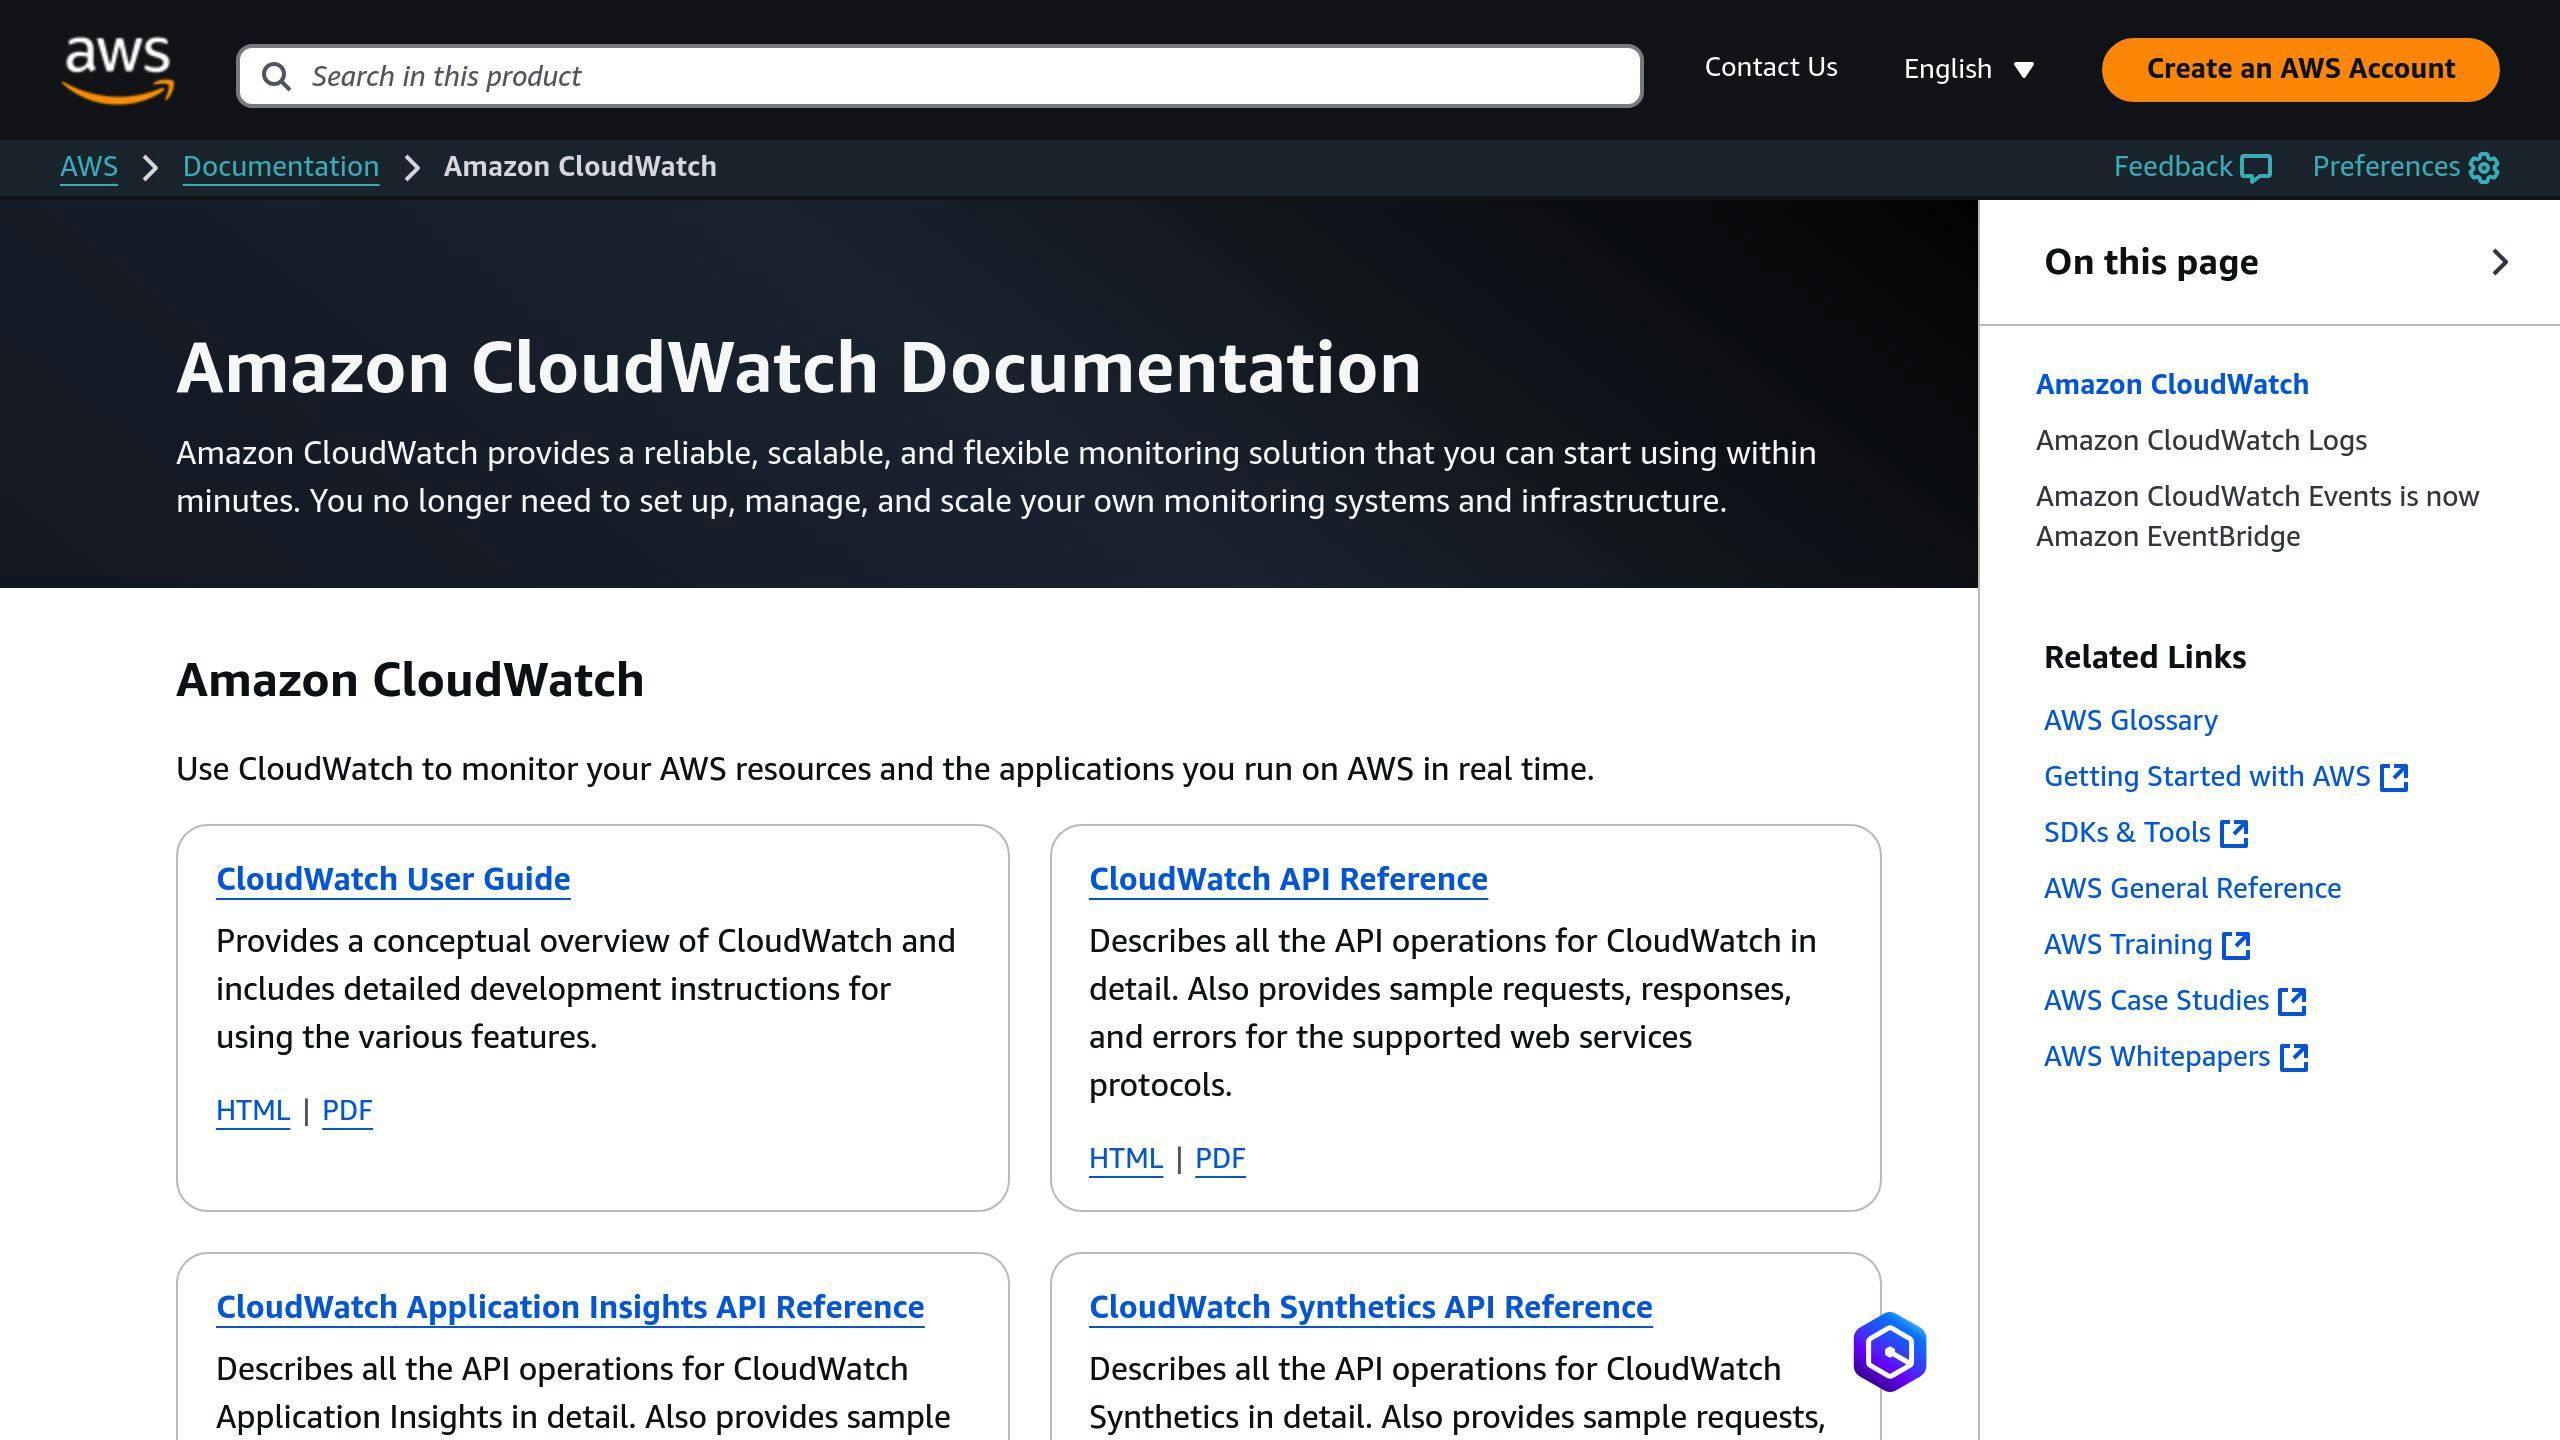
CloudWatch can supercharge your AWS monitoring in LogicMonitor. Here's how:
Keep data for longer
CloudWatch keeps log data forever by default. But that can get pricey. To manage it:
- Set up a log retention policy for all log groups.
- Use AWS CLI to set a retention period:
aws logs put-retention-policy --log-group-name my-curr-aws-logs --retention-in-days 365
This keeps data for a year, balancing availability and cost.
Mix different data types
Combine CloudWatch data with other metrics for a complete picture:
- Use LogicMonitor's AWS DataSources to query CloudWatch API.
- Customize metric paths with dimensions:
Namespace>Dimensions>Metric>AggregationMethod
Example for Route53 SSL Handshake Time:
AWS/Route53>HealthCheckId:##system.aws.resourceId##>Region:##system.aws.region##>SSLHandshakeTime>Average
- Mix CloudWatch metrics with your app data:
| Data Type | Source | Use Case |
|---|---|---|
| Infrastructure metrics | CloudWatch | Monitor AWS services |
| Application metrics | Your code | Track app performance |
| Custom metrics | Published to CloudWatch | Monitor business KPIs |
This combo gives you a full view of your AWS setup and apps.
Pro tip: CloudWatch API requests cost $0.01 per 1,000. To save money:
- Use LogicMonitor's Collector for EC2 instances
- Increase polling intervals for less critical resources
- Use LogicMonitor's Complex datapoints for calculations
4. Set up good alerts
Good alerts are key for keeping your AWS apps running smoothly. Here's how to do it:
Set the right alert levels
Don't get swamped with alerts. Be smart about it:
- Only send alerts that need quick action.
- Give specific rules higher priority.
- Use sensible thresholds. For example:
| Metric | Warning | Critical |
|---|---|---|
| CPU Use | 70% | 90% |
| Disk Space | 80% full | 95% full |
| Response Time | 2 seconds | 5 seconds |
- Test your alerts to make sure they work.
Create alert response plans
Know what to do when alerts hit:
- Make a clear plan for each alert type.
- Use LogicMonitor's tools:
- Acknowledge alerts
- Escalate to the right team
- Schedule downtime for maintenance
- Set up a main dashboard showing:
- App component status
- Monitored component widgets
- Front-end performance checks
This setup helps you spot issues fast.
sbb-itb-6210c22
5. Use LogicMonitor's AWS tools
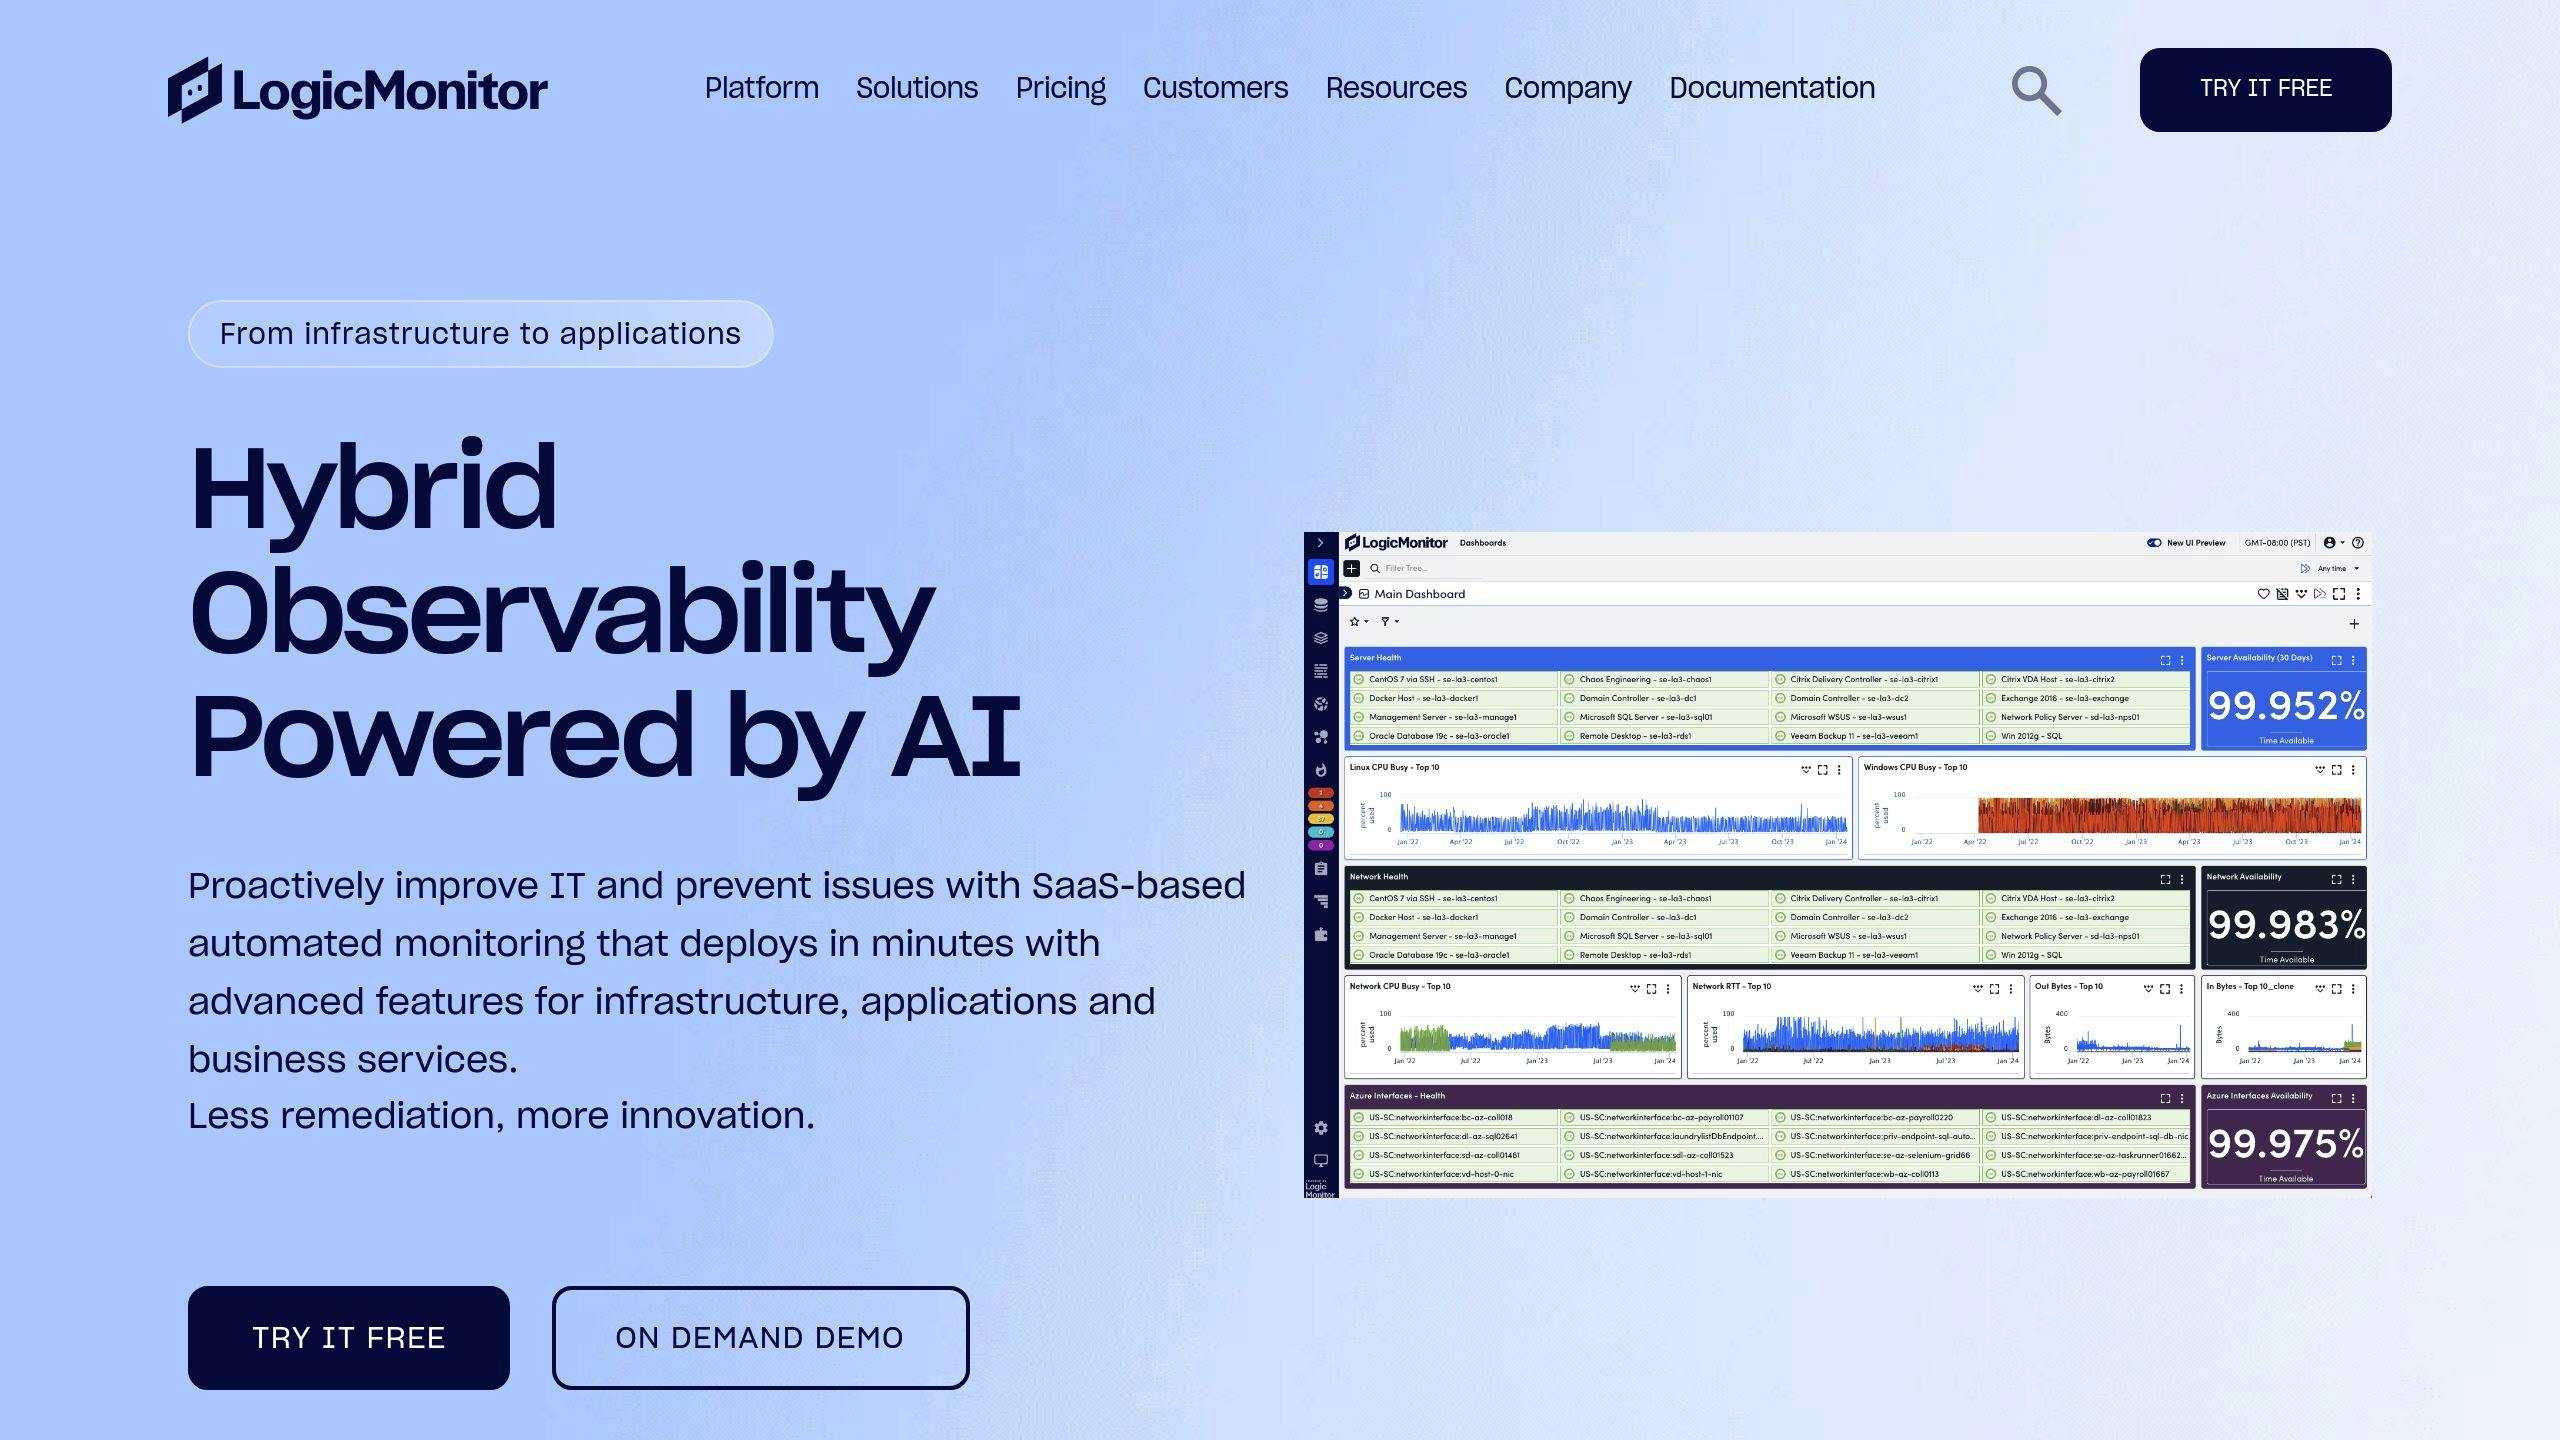
LogicMonitor offers two key features to simplify AWS monitoring:
Automatic resource finding
LogicMonitor finds and adds AWS resources automatically. Here's how:
- Set up Active Discovery in a DataSource
- LogicMonitor checks for changes regularly
- New resources are added automatically
To enable:
- Go to Settings > LogicModules > DataSources
- Select "DataSource" from the Add drop-down
- Fill in required fields
- Enable Multi-instance and Enable Active Discovery
AWS-specific dashboards
Create AWS resource dashboards:
- Click Dash in the left-hand menu
- Choose Add | New Dashboard
- Name and describe your dashboard
- Use Make Default for main view
- Pick Make Private for testing
AWS dashboard widgets:
| Widget Type | Use Case |
|---|---|
| CustomGraph | Show trends over time |
| Gauge | Display current metric values |
| Table | List multiple metrics or resources |
| NOC | Overview of system status |
| SLA | Track service level agreements |
| BigNumber | Highlight key metrics |
| Pie Chart | Show resource allocation |
| Alert list | Display active alerts |
Jon Davis, Integration Engineer at LogicMonitor: "I've built various dashboards, including a Fun Widgets dashboard that tracks alerts and devices with color-coded symbols for different alert levels."
Tips for effective AWS dashboards:
- Group related metrics
- Use color coding for quick status checks
- Include high-level and detailed views
- Update as your AWS setup changes
6. Manage AWS resources in LogicMonitor
LogicMonitor makes finding and organizing your AWS resources a breeze. Here's how it works and how to make it work for you.
Resource discovery
LogicMonitor's hosted collector automatically finds your AWS resources:
- Runs a NetScan every 5 minutes
- Looks for resources based on your settings
- Applies your tag filters
Need a fresh scan? Just hit 'Save' in your AWS Account group's 'Manage' section.
Naming and organization
LogicMonitor names your AWS stuff like this:
| Type | Format | Example |
|---|---|---|
| Device groups | AWS Service name | EC2, S3, SQS |
| Devices | region : instance name/id | US-W2:i-ca7777 |
You can rename EC2 resources, but others keep their default names.
Keep it tidy:
- Use AWS tags smartly. They become device properties in LogicMonitor.
- Create dynamic groups with tags:
system.aws.tag._NAME_=~"VALUE" - Set up AWS dashboards for easy viewing
Heads up: AWS tag filters are case-sensitive. Double-check your spelling!
7. Improve performance and lower costs
LogicMonitor helps you get more out of AWS while spending less. Here's how:
Track AWS usage and bills
Get a clear view of your AWS spending with LogicMonitor:
- Set up an S3 bucket for your AWS Cost and Usage Report
- Enable cost allocation tags in AWS
- Import billing DataSources into LogicMonitor
Build dashboards to spot trends:
| Dashboard Widget | Purpose |
|---|---|
| Service Costs | Top-spending services |
| Regional Costs | Expensive regions |
| Monthly Comparisons | Spending over time |
| Cost vs. Threshold | Budget adherence |
| Total AWS Costs | Month-to-date spending |
Use data to cut costs
Now, let's optimize:
1. Find over-provisioned resources
Create dashboards for underused assets:
| Dashboard | Purpose |
|---|---|
| Bottom 10 EC2 CPUs | Oversized instances |
| Bottom 10 DynamoDB Capacities | Excess capacity |
| Bottom 10 EBS IOPS | Unnecessary IOPS |
2. Hunt for unused resources
Use 'count' in Big Number Widgets to find:
- Stopped EC2 instances
- Unattached EBS volumes
3. Tweak your monitoring
Balance cost and performance:
- Use Collector DataSources when possible
- Increase polling intervals (watch for alert impacts)
- Cut unnecessary datapoints
- Deselect unused AWS regions
- Use tag filtering for resource discovery
4. Set smart alerts
Create spend thresholds to get notified when costs approach your budget.
Pro tip: Switching from CloudWatch to Collector DataSources for EC2 monitoring can save about $0.95 per instance per month. Small changes add up!
Conclusion
Let's recap the 7 best practices for AWS LogicMonitor integration:
- Set up accounts correctly
- Collect data efficiently
- Use CloudWatch features
- Set up good alerts
- Use LogicMonitor's AWS tools
- Manage AWS resources in LogicMonitor
- Improve performance and lower costs
These practices help you get the most out of your AWS and LogicMonitor setup. You'll have better control over your cloud infrastructure and can spot issues early.
Keep improving
AWS moves fast. Your monitoring needs to keep up. Here's how:
1. Check for updates
AWS and LogicMonitor release new features often. Review these monthly.
2. Test new metrics
As AWS adds services, try new metrics in LogicMonitor. Find what works for your setup.
3. Refine alerts
Look at your alert history quarterly. Too many false alarms? Not enough warnings? Adjust.
4. Learn from others
Join AWS and LogicMonitor user groups. Pick up tips from others facing similar challenges.
5. Regular audits
Every six months, review your entire monitoring setup. Make sure it matches your current AWS use.
Good monitoring is ongoing. Keep tweaking to get the best results.
"By setting up appropriate alarms and taking a proactive approach to observability, you can mitigate event delivery problems and build resilient, scalable, event-driven applications on AWS with EventBridge." - Maximilian Schellhorn, Senior Solutions Architect
This advice applies to your entire AWS setup. Stay alert, keep learning, and your AWS-LogicMonitor integration will serve you well.
FAQs
How to add AWS to LogicMonitor?
Adding AWS to LogicMonitor is simple. Here's how:
- Go to Resources > Add in LogicMonitor
- Choose Cloud and SaaS
- Click Add for Amazon Web Services
- Name your AWS account
- Click Next: Permissions
- Use LogicMonitor's values to set up in AWS:
- Create an IAM policy
- Make an IAM role
- Select Next: Services
- Pick AWS services to monitor
- Hit Test Permissions
You'll need to create that IAM policy and role in AWS. This lets LogicMonitor safely access your AWS data.
Once set up, LogicMonitor auto-discovers your AWS resources every 5 minutes. It uses your chosen services, regions, and tags to find what to monitor.
"A LogicMonitor hosted collector will search for and auto-discover AWS resources every five minutes using NetScan functionality."
This setup keeps your AWS monitoring current without manual updates.