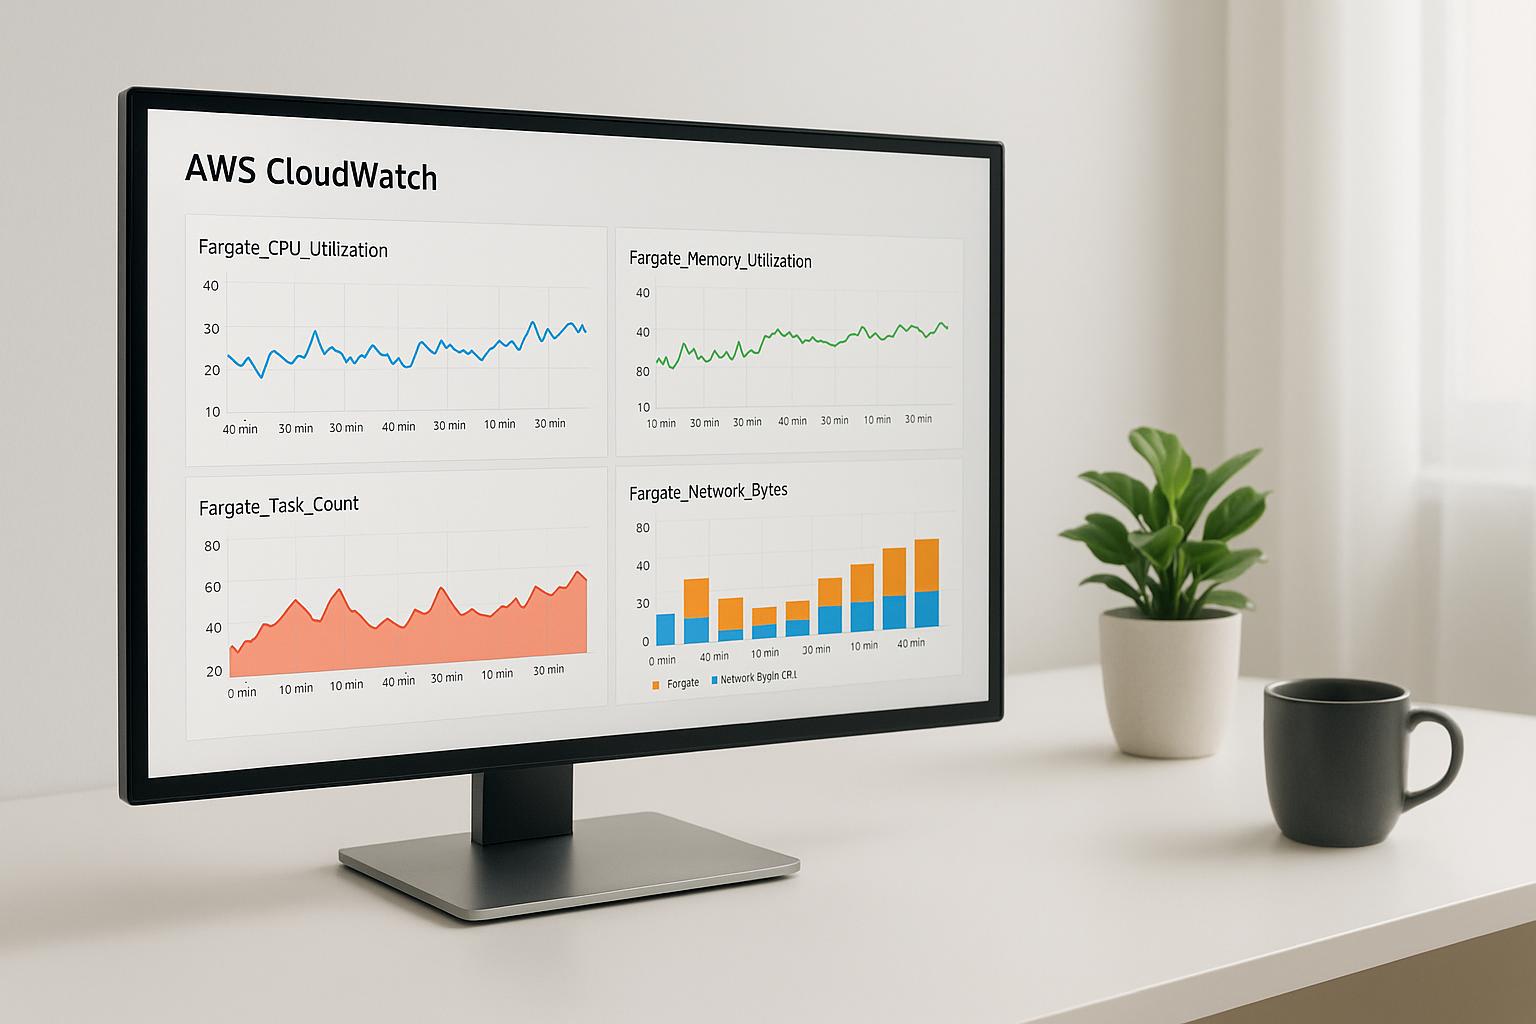
Monitoring AWS Lambda errors is crucial for ensuring reliable and efficient serverless applications. Here's how you can effectively track and resolve issues:
- Key Metrics to Monitor: Errors, Throttles, Duration, and ConcurrentExecutions.
- Common Errors to Watch: Unhandled exceptions, timeouts, memory issues, permission problems, and throttling.
- Tools to Use: AWS CloudWatch for metrics, logs, and alarms; AWS X-Ray for tracing; and CloudWatch Logs Insights for detailed log analysis.
- Best Practices:
- Set meaningful alerts for critical metrics.
- Automate responses to alarms using Lambda functions.
- Regularly review and update monitoring configurations.
Metrics and Error Types to Watch in AWS Lambda
Common Lambda Error Types
Keeping an eye on typical Lambda errors can help you troubleshoot and fix problems faster. Here are the main error types worth monitoring:
- Unhandled Exceptions: These occur when your code doesn't properly handle errors, leading to retries and higher costs. Use CloudWatch Logs to track and address them.
-
Timeouts: Functions nearing their timeout limits can cause disruptions. Keep an eye on the
Durationmetric and optimize functions as needed. - Memory Issues: When a function runs out of memory, it fails. Monitor the memory usage metric to ensure your function has enough resources. If memory usage is consistently high, increase the allocation.
- Permission Problems: Errors related to permissions, like missing IAM roles or policies, often show up in CloudWatch Logs. These logs can help pinpoint and resolve such issues.
-
Throttling: Throttling happens when functions exceed their concurrency limits. The
Throttlesmetric in CloudWatch reveals how often this occurs. If throttling is frequent, consider adjusting concurrency limits to reduce the impact.
By keeping these errors in check, you can use metrics to address them proactively and maintain performance.
Important Lambda Metrics
CloudWatch provides key metrics to help you monitor and respond to errors effectively. Here's a quick overview:
| Metric | Description | Why It Matters |
|---|---|---|
| Errors | Counts failed function invocations | Reflects how reliable your function is |
| Throttles | Tracks throttled function calls | Highlights concurrency bottlenecks |
| Duration | Measures function execution time | Helps identify performance trends |
| ConcurrentExecutions | Shows functions running at the same time | Indicates concurrent usage levels |
To calculate the error rate for your function, divide the Errors metric by the total number of Invocations.
For more detailed analysis, combine these metrics with AWS X-Ray tracing. This tool gives you an end-to-end view of your function's behavior, making it easier to identify and resolve root causes.
Using CloudWatch Lambda Insights
How to Set Up CloudWatch for Lambda Error Monitoring
To monitor Lambda errors effectively with CloudWatch, you need to set up the right metrics and configure alarms.
Creating Alarms in CloudWatch
CloudWatch alarms help you keep track of critical metrics and notify you when thresholds are crossed. To set one up, navigate to CloudWatch > Alarms in the AWS Console. Select the AWS Lambda namespace and pick the metrics for your function. Define thresholds based on your application's error tolerance and performance needs.
For automation, you can use the AWS CLI:
aws cloudwatch put-metric-alarm \
  --alarm-name "HighErrorRate" \
  --metric-name Errors \
  --namespace AWS/Lambda \
  --statistic Sum \
  --period 300 \
  --threshold 5 \
  --comparison-operator GreaterThanThreshold \
  --evaluation-periods 1 \
  --alarm-actions arn:aws:sns:us-east-1:123456789012:my-sns-topic
Key parameters:
alarm-name: A unique name for your alarmmetric-name: The specific metric you want to monitorperiod: Evaluation interval in seconds (300 = 5 minutes)threshold: Value that, when exceeded, triggers the alarmevaluation-periods: Number of intervals before the alarm activatesalarm-actions: Amazon SNS topic ARN for notifications
Set your alarm actions to notify your team via Amazon SNS whenever a threshold is breached. This ensures you’re immediately alerted to critical issues.
While alarms provide real-time notifications, analyzing logs gives you a deeper understanding of your function's behavior.
Using CloudWatch Logs Insights
Analyzing logs is crucial for diagnosing and fixing errors. CloudWatch Logs Insights offers a powerful query tool for digging into your log data. Here's an example query:
filter @type = "REPORT"
| stats avg(@duration) as avgDuration,
        max(@duration) as maxDuration,
        min(@duration) as minDuration
by bin(30m)
Tips for effective log analysis:
- Start Simple: Begin with basic queries focused on error messages and gradually refine them.
- Group by Time: Use time intervals to spot trends or recurring issues.
- Filter Smartly: Narrow down logs to focus on specific error types or severe problems.
For a more detailed view of your Lambda execution, combine CloudWatch with AWS X-Ray to trace requests end-to-end.
| Monitoring Task | Tool | Purpose |
|---|---|---|
| Error Detection | CloudWatch Alarms | Real-time alerts for error thresholds |
| Log Analysis | CloudWatch Logs Insights | Spot patterns and debug issues |
| Performance Tracing | AWS X-Ray | Track requests from start to finish |
sbb-itb-6210c22
Best Practices for Monitoring Lambda Errors
Using Multiple Monitoring Tools
CloudWatch is a powerful tool for monitoring your Lambda functions, but pairing it with others can give you a more complete picture. CloudWatch provides metrics, logs, and alerts, while AWS X-Ray adds detailed tracing to track requests through your architecture. You can also integrate third-party tools for additional features tailored to your specific needs.
| Tool | Purpose |
|---|---|
| CloudWatch | Metrics, logs, and alerts |
| AWS X-Ray | Tracing requests end-to-end |
| Third-party tools | Extra monitoring capabilities |
Setting Meaningful Alerts
Alerts are essential for catching issues without overwhelming your team with noise. Focus on key metrics that directly affect your application's performance:
Key Metrics to Monitor:
- Error rates that deviate from normal levels
- Function execution times nearing their timeout limits
- Memory usage exceeding 80%
- A rise in throttling events
Tailor thresholds to fit the environment. For instance, production systems might need stricter settings (e.g., error rates >1%) compared to development setups (e.g., >5%).
Here’s an example of how to set up an alert using CloudWatch:
aws cloudwatch put-metric-alarm \
  --alarm-name "HighErrorRate" \
  --metric-name Errors \
  --namespace AWS/Lambda \
  --period 300 \
  --threshold 1 \
  --comparison-operator GreaterThanPercentThreshold
Keep in mind that as your application evolves, you’ll need to fine-tune these alerts to stay effective.
Reviewing Monitoring Settings Regularly
Make it a habit to review your monitoring setup every month. Check settings like CloudWatch Log retention periods, alert thresholds, custom metrics, X-Ray sampling rates, and notification channels to ensure they’re still relevant.
During these reviews, use tools like CloudWatch Logs Insights to analyze data and uncover trends:
filter @type = "REPORT"
| stats count(*) as invocations,
        avg(@duration) as avgDuration,
        max(@duration) as maxDuration
by bin(1h)
| sort by avgDuration desc
This type of analysis can reveal patterns in performance and execution times, helping you adjust your monitoring strategy before issues arise.
Advanced Techniques for Monitoring Lambda Errors
Using AWS X-Ray for Tracing
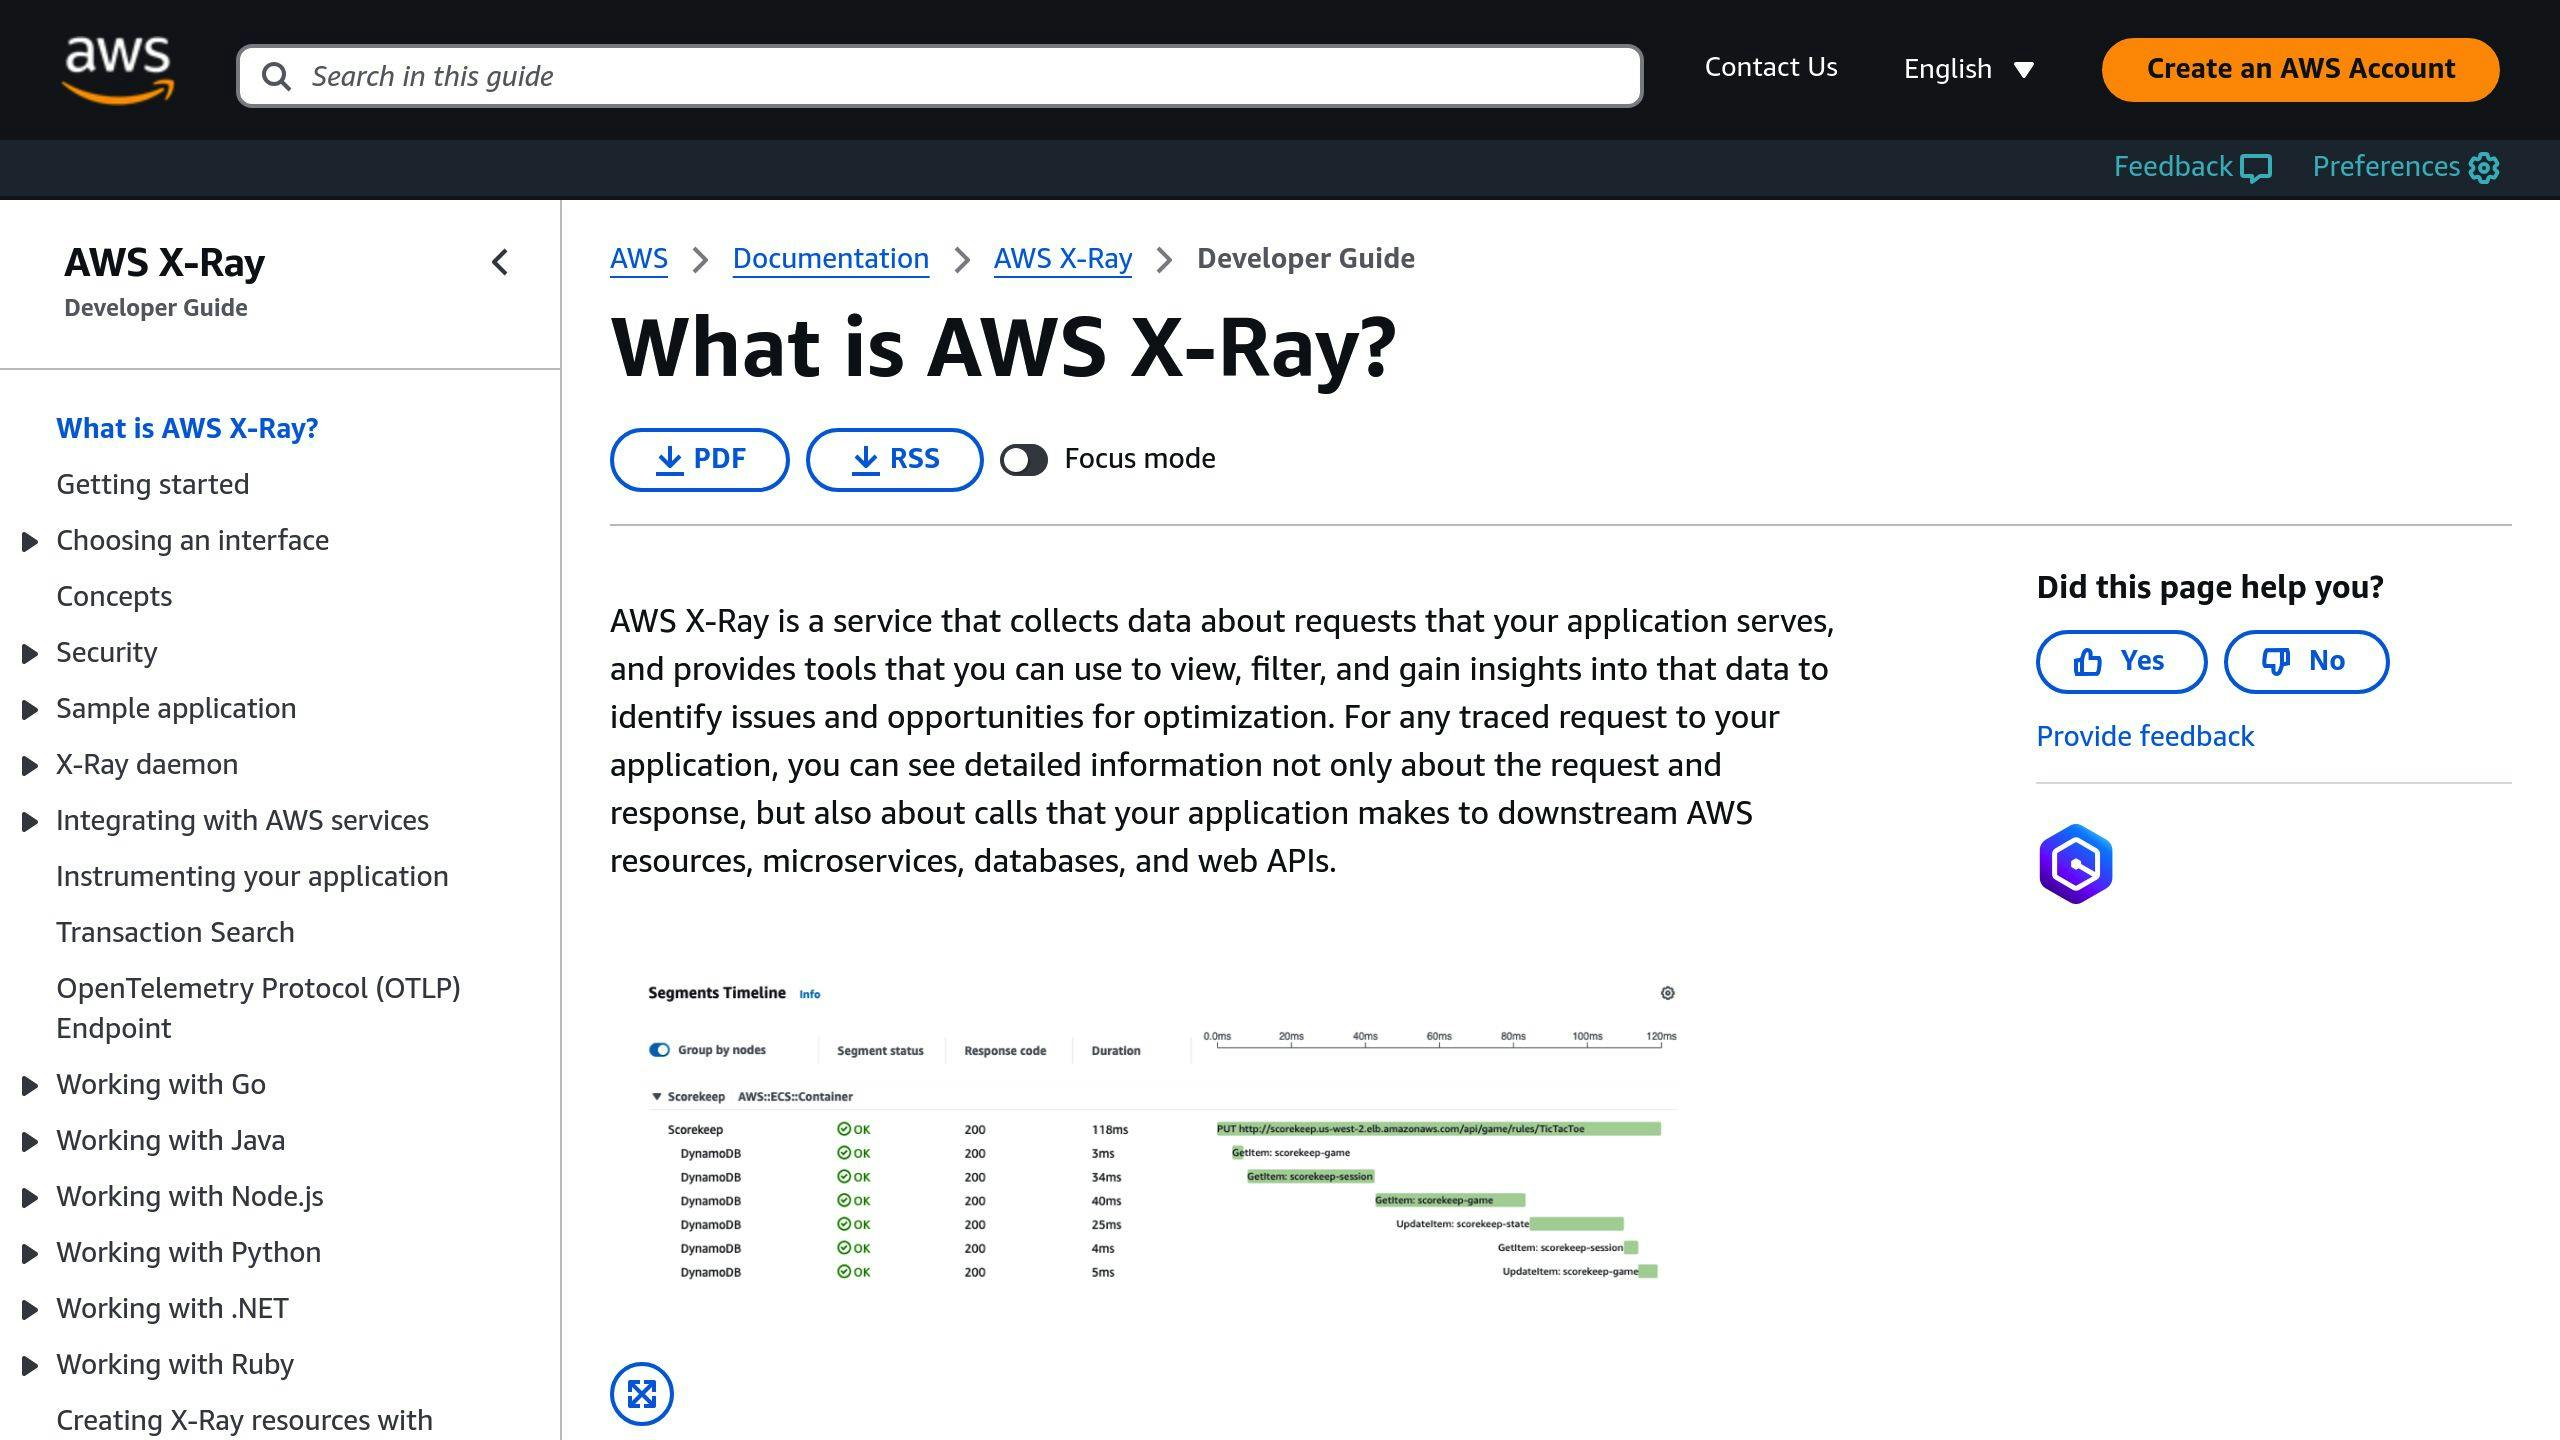
AWS X-Ray helps you trace requests across your application, making it easier to identify bottlenecks and diagnose issues that might not be obvious through CloudWatch metrics.
Here’s how to get the most out of X-Ray with Lambda:
1. Enable X-Ray Selectively
Turn on X-Ray for the most critical functions or those with complex dependencies. This helps you focus on key areas without incurring unnecessary costs.
2. Set Up Sampling Rules
Use custom sampling rules to strike a balance between cost and visibility. For example, you could sample 5% of requests during normal operations and increase it to 25% when troubleshooting.
Automating Responses to Alarms
Monitoring is great for visibility, but automation can speed up the resolution of critical issues.
| Alarm Trigger | Automated Response | Implementation Method |
|---|---|---|
| High Error Rate or Memory Usage > 80% | Scale resources or adjust memory allocation | Lambda + CloudWatch Alarm Action |
| Cold Start Spikes | Provision concurrency | EventBridge + Lambda |
To automate responses effectively:
- Create a Lambda function that is triggered by CloudWatch alarms to handle specific remediation actions.
- Set up proper IAM permissions to ensure the Lambda function has access to necessary resources.
- Test the automation in a staging environment to ensure it works as expected.
Here’s an example Lambda function that increases memory allocation automatically when triggered:
import boto3

def lambda_handler(event, context):
    lambda_client = boto3.client('lambda')

    # Increase memory for the affected function
    response = lambda_client.update_function_configuration(
        FunctionName='affected-function-name',
        MemorySize=512  # Adjust memory allocation
    )
This kind of automation can make a big difference in maintaining application performance and minimizing downtime.
Conclusion
Summary of Key Points
Keeping track of Lambda errors is crucial for maintaining dependable serverless applications. CloudWatch plays a major role in monitoring by providing metrics and logs to help diagnose problems. Meanwhile, AWS X-Ray offers tracing capabilities to pinpoint bottlenecks and troubleshoot complex issues.
Here are some essential monitoring practices:
| Practice | Description |
|---|---|
| Multi-layer Monitoring | Use metrics, logs, and traces together for better visibility. |
| Automated Response Systems | Set up automated error handling to minimize downtime. |
| Regular Monitoring Review | Update your monitoring setup as the application evolves. |
Effective alerts and layered monitoring are key to identifying issues early. By leveraging CloudWatch, AWS X-Ray, and automation, you can build a monitoring system that reduces downtime and improves performance.
Additional Resources
For more detailed guidance on these practices, check out the following:
- AWS CloudWatch documentation: Learn how to configure metrics effectively.
- AWS X-Ray documentation: Dive into advanced tracing techniques.
- AWS Lambda best practices guide: Optimize your Lambda functions for better performance.
Also, visit AWS for Engineers for in-depth technical guides created for software engineers.
Regularly revisiting and refining your monitoring strategy ensures your Lambda functions stay efficient, cost-effective, and reliable over time.
FAQs
This section answers common questions about monitoring and resolving AWS Lambda errors, along with steps to troubleshoot effectively.
How can I get alerts for Lambda failures?
To set up alerts for Lambda failures, follow these steps:
- Create a CloudWatch alarm for your function's 'Errors' metric.
- Link the alarm to an SNS topic to manage notifications.
- Add email subscribers to the SNS topic to receive alerts.
For more advanced monitoring, you can:
- Use metric filters in CloudWatch Logs to detect specific error patterns.
- Set different thresholds depending on the environment (e.g., stricter for production).
- Enable additional notification channels like SMS or Slack through SNS.
What happens when Lambda encounters an error during event processing?
How Lambda deals with errors depends on the invocation type:
- Synchronous Invocations: No automatic retries; the client needs to handle retries.
- Asynchronous Invocations (e.g., SNS, EventBridge): The event source manages retries automatically.
- Stream-based Invocations: Retry behavior can be customized for each service.
To manage errors effectively:
- Use dead-letter queues to capture failed asynchronous invocations.
- Add custom retry logic for synchronous calls.
- Monitor error trends using CloudWatch metrics.
- Set appropriate timeout values to prevent unnecessary failures.
Combining these strategies with tools like CloudWatch and AWS X-Ray can help you maintain better control over error handling in your Lambda functions.
