AWS Lambda Insights is a monitoring and troubleshooting tool that provides in-depth observability for serverless applications running on AWS Lambda. It helps you:
- Identify performance bottlenecks
- Troubleshoot issues
- Optimize resource utilization
Key Features
- Collects system-level metrics like CPU time, memory usage, disk usage, and network usage
- Provides diagnostic information such as cold starts and Lambda worker shutdowns
- Integrates with CloudWatch for custom metrics, alerts, and data visualization
- Supports multiple runtimes including Node.js, Python, Java, Go, and .NET Core
Benefits
| Benefit | Description |
|---|---|
| Improved Performance | Identify and resolve performance bottlenecks |
| Enhanced Troubleshooting | Quickly detect and troubleshoot issues |
| Cost Optimization | Reduce costs by optimizing resource allocation |
| Simplified Monitoring | Unified monitoring and debugging solution |
| Improved Security | Monitor function execution and identify risks |
By leveraging AWS Lambda Insights, you can gain deeper insights into your serverless application's performance, optimize resources, and ensure reliability and security.
Key Monitoring Concepts for AWS Lambda
Monitoring AWS Lambda functions requires understanding key concepts that help you gain insights into performance, reliability, and security. These concepts are essential for identifying issues, optimizing resources, and improving overall application performance.
Metrics
Metrics provide numerical data about your Lambda function's performance and behavior. AWS Lambda publishes metrics to CloudWatch, including:
| Metric | Description |
|---|---|
| Invocations | Number of times a Lambda function is executed |
| Duration | Time taken for a Lambda function to complete execution |
| Errors | Number of errors that occur during Lambda function execution |
| Throttles | Number of times a Lambda function is throttled due to excessive concurrency |
You can also create custom metrics to track specific aspects of your Lambda functions.
Logs
Logs are timestamped records of events that occur within your Lambda functions. AWS Lambda logs errors, warnings, and informational messages to CloudWatch Logs. You can also log custom events and exceptions using the AWS Lambda logging API.
Logs are crucial for troubleshooting issues, identifying performance bottlenecks, and debugging your Lambda functions.
Alerts
Alerts are notifications triggered when a metric or log event exceeds a specified threshold. You can set up alerts in CloudWatch to notify your team of potential issues, such as:
- High error rates
- Increased latency
- Excessive concurrency
Alerts enable you to take proactive measures to address issues before they impact your users.
Visualization
Visualization is the process of converting metrics and logs into graphical representations, such as charts, graphs, and dashboards. Visualization helps you quickly identify trends, patterns, and anomalies in your Lambda function performance.
AWS Lambda provides built-in visualization capabilities through CloudWatch, including:
- Metric charts: Visualize metrics over time to identify trends and patterns
- Log analytics: Analyze log data to identify errors, exceptions, and performance bottlenecks
- Dashboards: Create custom dashboards to visualize key metrics and logs in a single view
Tracing
Tracing is the process of tracking the flow of requests through your Lambda functions and related services. AWS X-Ray provides distributed tracing capabilities for AWS Lambda, enabling you to:
- Track request latency: Identify performance bottlenecks and optimize request processing
- Debug issues: Trace errors and exceptions to identify root causes
- Optimize resource utilization: Identify opportunities to optimize resource allocation and reduce costs
By understanding these key monitoring concepts, you can effectively monitor and troubleshoot your AWS Lambda functions, ensuring high performance, reliability, and security for your serverless applications.
AWS Lambda Insights Features Overview
AWS Lambda Insights is a monitoring and troubleshooting solution for serverless applications running on AWS Lambda. It provides a comprehensive view of your Lambda function's performance, allowing you to identify issues, optimize resources, and improve overall application reliability.
Enhanced Monitoring Capabilities
Lambda Insights collects and summarizes system-level metrics, including:
| Metric | Description |
|---|---|
| CPU time | Time spent executing your Lambda function |
| Memory usage | Amount of memory used by your Lambda function |
| Disk usage | Amount of disk space used by your Lambda function |
| Network usage | Amount of network bandwidth used by your Lambda function |
| Diagnostic information | Cold starts, Lambda worker shutdowns, and other diagnostic data |
This enables you to isolate issues with your Lambda functions and resolve them quickly.
Integration with CloudWatch

Lambda Insights integrates with CloudWatch, allowing you to:
- Create custom metrics
- Set up alerts
- Visualize performance data
This integration provides a more comprehensive view of your Lambda function's performance.
Supported Lambda Runtimes
Lambda Insights supports the following Lambda runtimes:
- Node.js
- Python
- Java
- Go *.NET Core
This ensures that you can monitor and troubleshoot your Lambda functions regardless of the programming language or runtime environment used.
By leveraging the features of Lambda Insights, you can gain a deeper understanding of your Lambda function's performance, identify bottlenecks, and optimize resources to improve overall application reliability and efficiency.
Enabling AWS Lambda Insights
Enabling AWS Lambda Insights is a straightforward process that can be done through the AWS console or programmatically. This section will guide you through the step-by-step instructions for enabling Lambda Insights for both new and existing Lambda functions.
Enabling Lambda Insights through the AWS Console
To enable Lambda Insights through the AWS console, follow these steps:
1. Open the AWS Lambda console: Go to https://console.aws.amazon.com/lambda/. 2. Choose the Lambda function: Select the name of the Lambda function for which you want to enable Lambda Insights. 3. Select the Configuration tab: Navigate to Monitoring and operations tools in the left navigation menu. 4. Toggle the switch to Enable: Under CloudWatch Lambda Insights, toggle the switch to Enable. 5. Save your changes: Click Save to save your changes.
Enabling Lambda Insights Programmatically
To enable Lambda Insights programmatically, you can use the AWS CLI or an AWS SDK. Here's an example using the AWS CLI:
aws lambda update-function-configuration --function-name <function-name> --layers arn:aws:lambda:<region>:580247275435:layer:LambdaInsightsExtension:14
Replace <function-name> with the name of your Lambda function, and <region> with the region where your function is located.
Configuring Lambda Insights for Existing Lambda Functions
If you have existing Lambda functions, you can enable Lambda Insights for them by following the same steps as above. Make sure to update the function configuration to include the Lambda Insights layer.
By enabling Lambda Insights, you can gain a deeper understanding of your Lambda function's performance, identify bottlenecks, and optimize resources to improve overall application reliability and efficiency.
Using the Lambda Insights Dashboard
The Lambda Insights dashboard is a powerful tool for monitoring and troubleshooting your serverless applications running on AWS Lambda. In this section, we'll explore how to use the dashboard to gain insights into your function's performance and identify potential issues.
Multi-Function Overview
The multi-function overview page provides a high-level view of all your Lambda functions, allowing you to quickly identify trends and patterns across your application. You can view metrics such as:
| Metric | Description |
|---|---|
| Invocation count | Number of times a Lambda function is executed |
| Error rate | Number of errors that occur during Lambda function execution |
| Average duration | Time taken for a Lambda function to complete execution |
To view the runtime metrics for all functions:
- Open the Multi-function page in the CloudWatch console.
- Choose from the predefined time ranges, or choose a custom time range.
- (Optional) Choose Add to dashboard to add the widgets to your CloudWatch dashboard.
Single-Function View
The single-function view provides a detailed look at a specific Lambda function, allowing you to drill down into its performance and identify potential bottlenecks. You can view metrics such as:
| Metric | Description |
|---|---|
| Invocation count | Number of times a Lambda function is executed |
| Error rate | Number of errors that occur during Lambda function execution |
| Average duration | Time taken for a Lambda function to complete execution |
To view the runtime metrics of a single function:
- Open the Single-function page in the CloudWatch console.
- Choose from the predefined time ranges, or choose a custom time range.
- (Optional) Choose Add to dashboard to add the widgets to your CloudWatch dashboard.
By using the Lambda Insights dashboard, you can quickly identify performance issues, troubleshoot errors, and optimize your Lambda functions for better performance and reliability. In the next section, we'll explore how to create monitoring queries in Lambda Insights to gain even more insights into your application's performance.
sbb-itb-6210c22
Creating Monitoring Queries in Lambda Insights
Creating monitoring queries in Lambda Insights is a crucial step in gaining insights into your serverless application's performance. With Lambda Insights, you can create custom queries to monitor and troubleshoot your Lambda functions, identify performance bottlenecks, and optimize your application for better performance and reliability.
Example Queries for Common Monitoring Scenarios
Here are some example queries you can use to monitor common scenarios in your Lambda functions:
1. Last 100 Errors
To view the last 100 errors in your Lambda function, use the following query:
fields Timestamp, LogLevel, Message | filter LogLevel == "ERR" | sort @timestamp desc | limit 100
This query filters the logs for errors (LogLevel == "ERR") and returns the last 100 errors in descending order of timestamp.
2. Top 100 Highest Billed Invocations
To view the top 100 highest billed invocations in your Lambda function, use the following query:
filter @type = "REPORT" | fields @requestId, @billedDuration | sort by @billedDuration desc | limit 100
This query filters the logs for REPORT type (which includes billed duration) and returns the top 100 highest billed invocations in descending order of billed duration.
3. Percentage of Cold Starts in Total Invocations
To view the percentage of cold starts in total invocations in your Lambda function, use the following query:
filter @type = "REPORT" | stats sum(strcontains(@message, "Init Duration"))/count(*) * 100 as coldStartPct, avg(@duration) by bin(5m)
This query filters the logs for REPORT type and calculates the percentage of cold starts (Init Duration) in total invocations, along with the average duration, grouped by 5-minute bins.
Here is a table summarizing the example queries:
| Query | Description |
|---|---|
| Last 100 Errors | View the last 100 errors in your Lambda function |
| Top 100 Highest Billed Invocations | View the top 100 highest billed invocations in your Lambda function |
| Percentage of Cold Starts in Total Invocations | Calculate the percentage of cold starts in total invocations in your Lambda function |
By using Lambda Insights, you can gain deeper insights into your application's performance and optimize it for better performance and reliability.
In the next section, we'll explore the Lambda Insights metrics catalog and how to use it to gain insights into your application's performance.
Lambda Insights Metrics Catalog
Overview of Lambda Insights Metrics
AWS Lambda Insights provides a range of metrics that help you monitor and troubleshoot your serverless applications. These metrics offer valuable insights into the performance, reliability, and cost-effectiveness of your Lambda functions.
Invocation Metrics
Invocation metrics provide insights into the execution of your Lambda functions. Some key invocation metrics include:
| Metric | Description |
|---|---|
| Invocations | The total number of times your Lambda function is executed. |
| Errors | The number of invocations that result in function errors. |
| Throttles | The number of invocation requests that are throttled due to concurrency limits. |
Performance Metrics
Performance metrics help you understand the efficiency and responsiveness of your Lambda functions. Some key performance metrics include:
| Metric | Description |
|---|---|
| Duration | The time taken by your Lambda function to process an event. |
| IteratorAge | The age of the oldest event record in an event source mapping. |
| MemoryUtilization | The percentage of memory used by your Lambda function. |
Concurrency Metrics
Concurrency metrics provide insights into the concurrent execution of your Lambda functions. Some key concurrency metrics include:
| Metric | Description |
|---|---|
| ConcurrentExecutions | The number of instances of your Lambda function processing events concurrently. |
| ProvisionedConcurrency | The number of instances of your Lambda function allocated for provisioned concurrency. |
| ProvisionedConcurrencyUtilization | The percentage of provisioned concurrency utilized by your Lambda function. |
Cost Metrics
Cost metrics help you understand the cost-effectiveness of your Lambda functions. Some key cost metrics include:
| Metric | Description |
|---|---|
| EstimatedCost | The estimated cost of executing your Lambda function. |
| BilledDuration | The billed duration of your Lambda function execution. |
By leveraging these metrics, you can gain a deeper understanding of your serverless application's performance, reliability, and cost-effectiveness. In the next section, we'll explore how to optimize performance with Lambda Insights.
Costs of Using AWS Lambda Insights
When using AWS Lambda Insights, it's essential to understand the costs associated with this serverless monitoring tool. In this section, we'll break down the pricing model and provide guidance on managing expenses.
Pricing Model
AWS Lambda Insights reports metrics and sends log data to CloudWatch for every function invocation. You only pay for the metrics and logs reported for your function by Lambda Insights. There are no minimum fees or mandatory service usage policies. Additionally, you don't pay for Lambda Insights if the function is not invoked.
Cost Factors
To estimate the costs of using AWS Lambda Insights, consider the following factors:
| Factor | Description |
|---|---|
| Number of invocations | The more your Lambda function is invoked, the more log data is generated, and the higher the costs. |
| Log data volume | The amount of log data sent to CloudWatch affects the ingestion cost. |
| Storage duration | The longer you store your log data, the higher the storage costs. |
| Query frequency | Running queries on your log data incurs additional costs. |
Strategies for Managing Costs
To optimize your expenses, follow these strategies:
- Monitor and analyze your usage: Keep track of your Lambda function invocations, log data volume, and query frequency to identify areas for cost reduction.
- Optimize your Lambda function code: Ensure your code is efficient and minimizes the number of invocations and log data generated.
- Use cost-effective storage options: Consider using Amazon S3 or Amazon Glacier for long-term log data storage, which can be more cost-effective than CloudWatch Logs.
- Limit query frequency: Run queries only when necessary, and use cost-effective query options, such as scanning a smaller dataset.
By understanding the pricing model and implementing cost-saving strategies, you can effectively manage your expenses and maximize the benefits of using AWS Lambda Insights for serverless monitoring.
Optimizing Performance with Lambda Insights
Optimizing performance is crucial to ensure your serverless applications running on AWS Lambda are efficient, scalable, and cost-effective. AWS Lambda Insights provides a comprehensive monitoring and troubleshooting solution to help you identify performance bottlenecks and optimize your Lambda functions.
Common Performance Challenges
Serverless applications can face various performance issues, including:
- Cold starts: The initial invocation of a Lambda function can be slow due to initialization time.
- Function duration: Long-running functions can lead to increased latency, higher costs, and reduced throughput.
- Memory allocation: Insufficient memory allocation can cause functions to fail or run slowly, while excessive allocation can lead to wasted resources and higher costs.
- Concurrency: Inadequate concurrency settings can result in throttling, errors, or slow response times.
Solutions with Lambda Insights
Lambda Insights provides features to help you overcome these performance challenges:
| Feature | Description |
|---|---|
| Function metrics | Collects and aggregates metrics on function invocations, duration, errors, and throttles. |
| Log analysis | Analyzes logs to pinpoint issues, such as cold starts, memory allocation problems, or concurrency limitations. |
| Diagnostic information | Provides diagnostic information, including cold start metrics, initialization time, and function execution time. |
Best Practices for Optimizing Performance
To ensure optimal performance with Lambda Insights, follow these best practices:
- Monitor and analyze performance metrics: Regularly review function metrics and logs to identify areas for improvement.
- Optimize function code: Ensure your function code is efficient, and minimize the use of external dependencies to reduce initialization time.
- Right-size memory allocation: Allocate sufficient memory to your functions while avoiding excessive allocation to minimize costs and optimize performance.
- Configure concurrency: Set appropriate concurrency settings to handle expected traffic and minimize throttling or errors.
By leveraging Lambda Insights and following these best practices, you can optimize the performance of your serverless applications, reduce costs, and improve overall efficiency.
Benefits of AWS Lambda Insights Monitoring
AWS Lambda Insights provides several benefits for monitoring and troubleshooting serverless applications running on AWS Lambda. Here are some of the key advantages:
Improved Performance
Lambda Insights helps you identify performance bottlenecks, optimize function code, and allocate memory efficiently, leading to improved application performance and reduced latency.
Enhanced Troubleshooting
With Lambda Insights, you can quickly identify and troubleshoot issues, such as cold starts, function errors, and throttles, reducing the time it takes to detect and resolve problems.
Cost Optimization
By optimizing function performance and resource allocation, you can reduce costs associated with Lambda function invocations, memory allocation, and concurrency settings.
Simplified Monitoring and Debugging
Lambda Insights provides a unified monitoring and troubleshooting solution, eliminating the need for multiple tools and services, and simplifying the monitoring and debugging process.
Improved Security and Compliance
With Lambda Insights, you can monitor and analyze function execution, identify potential security risks, and ensure compliance with regulatory requirements.
Here is a summary of the benefits of using AWS Lambda Insights:
| Benefit | Description |
|---|---|
| Improved Performance | Identify performance bottlenecks and optimize function code |
| Enhanced Troubleshooting | Quickly identify and troubleshoot issues |
| Cost Optimization | Reduce costs associated with Lambda function invocations and resource allocation |
| Simplified Monitoring and Debugging | Unified monitoring and troubleshooting solution |
| Improved Security and Compliance | Monitor and analyze function execution, identify potential security risks, and ensure compliance |
By using AWS Lambda Insights, you can ensure the health, performance, and security of your serverless applications, while reducing costs and improving overall efficiency.
FAQs
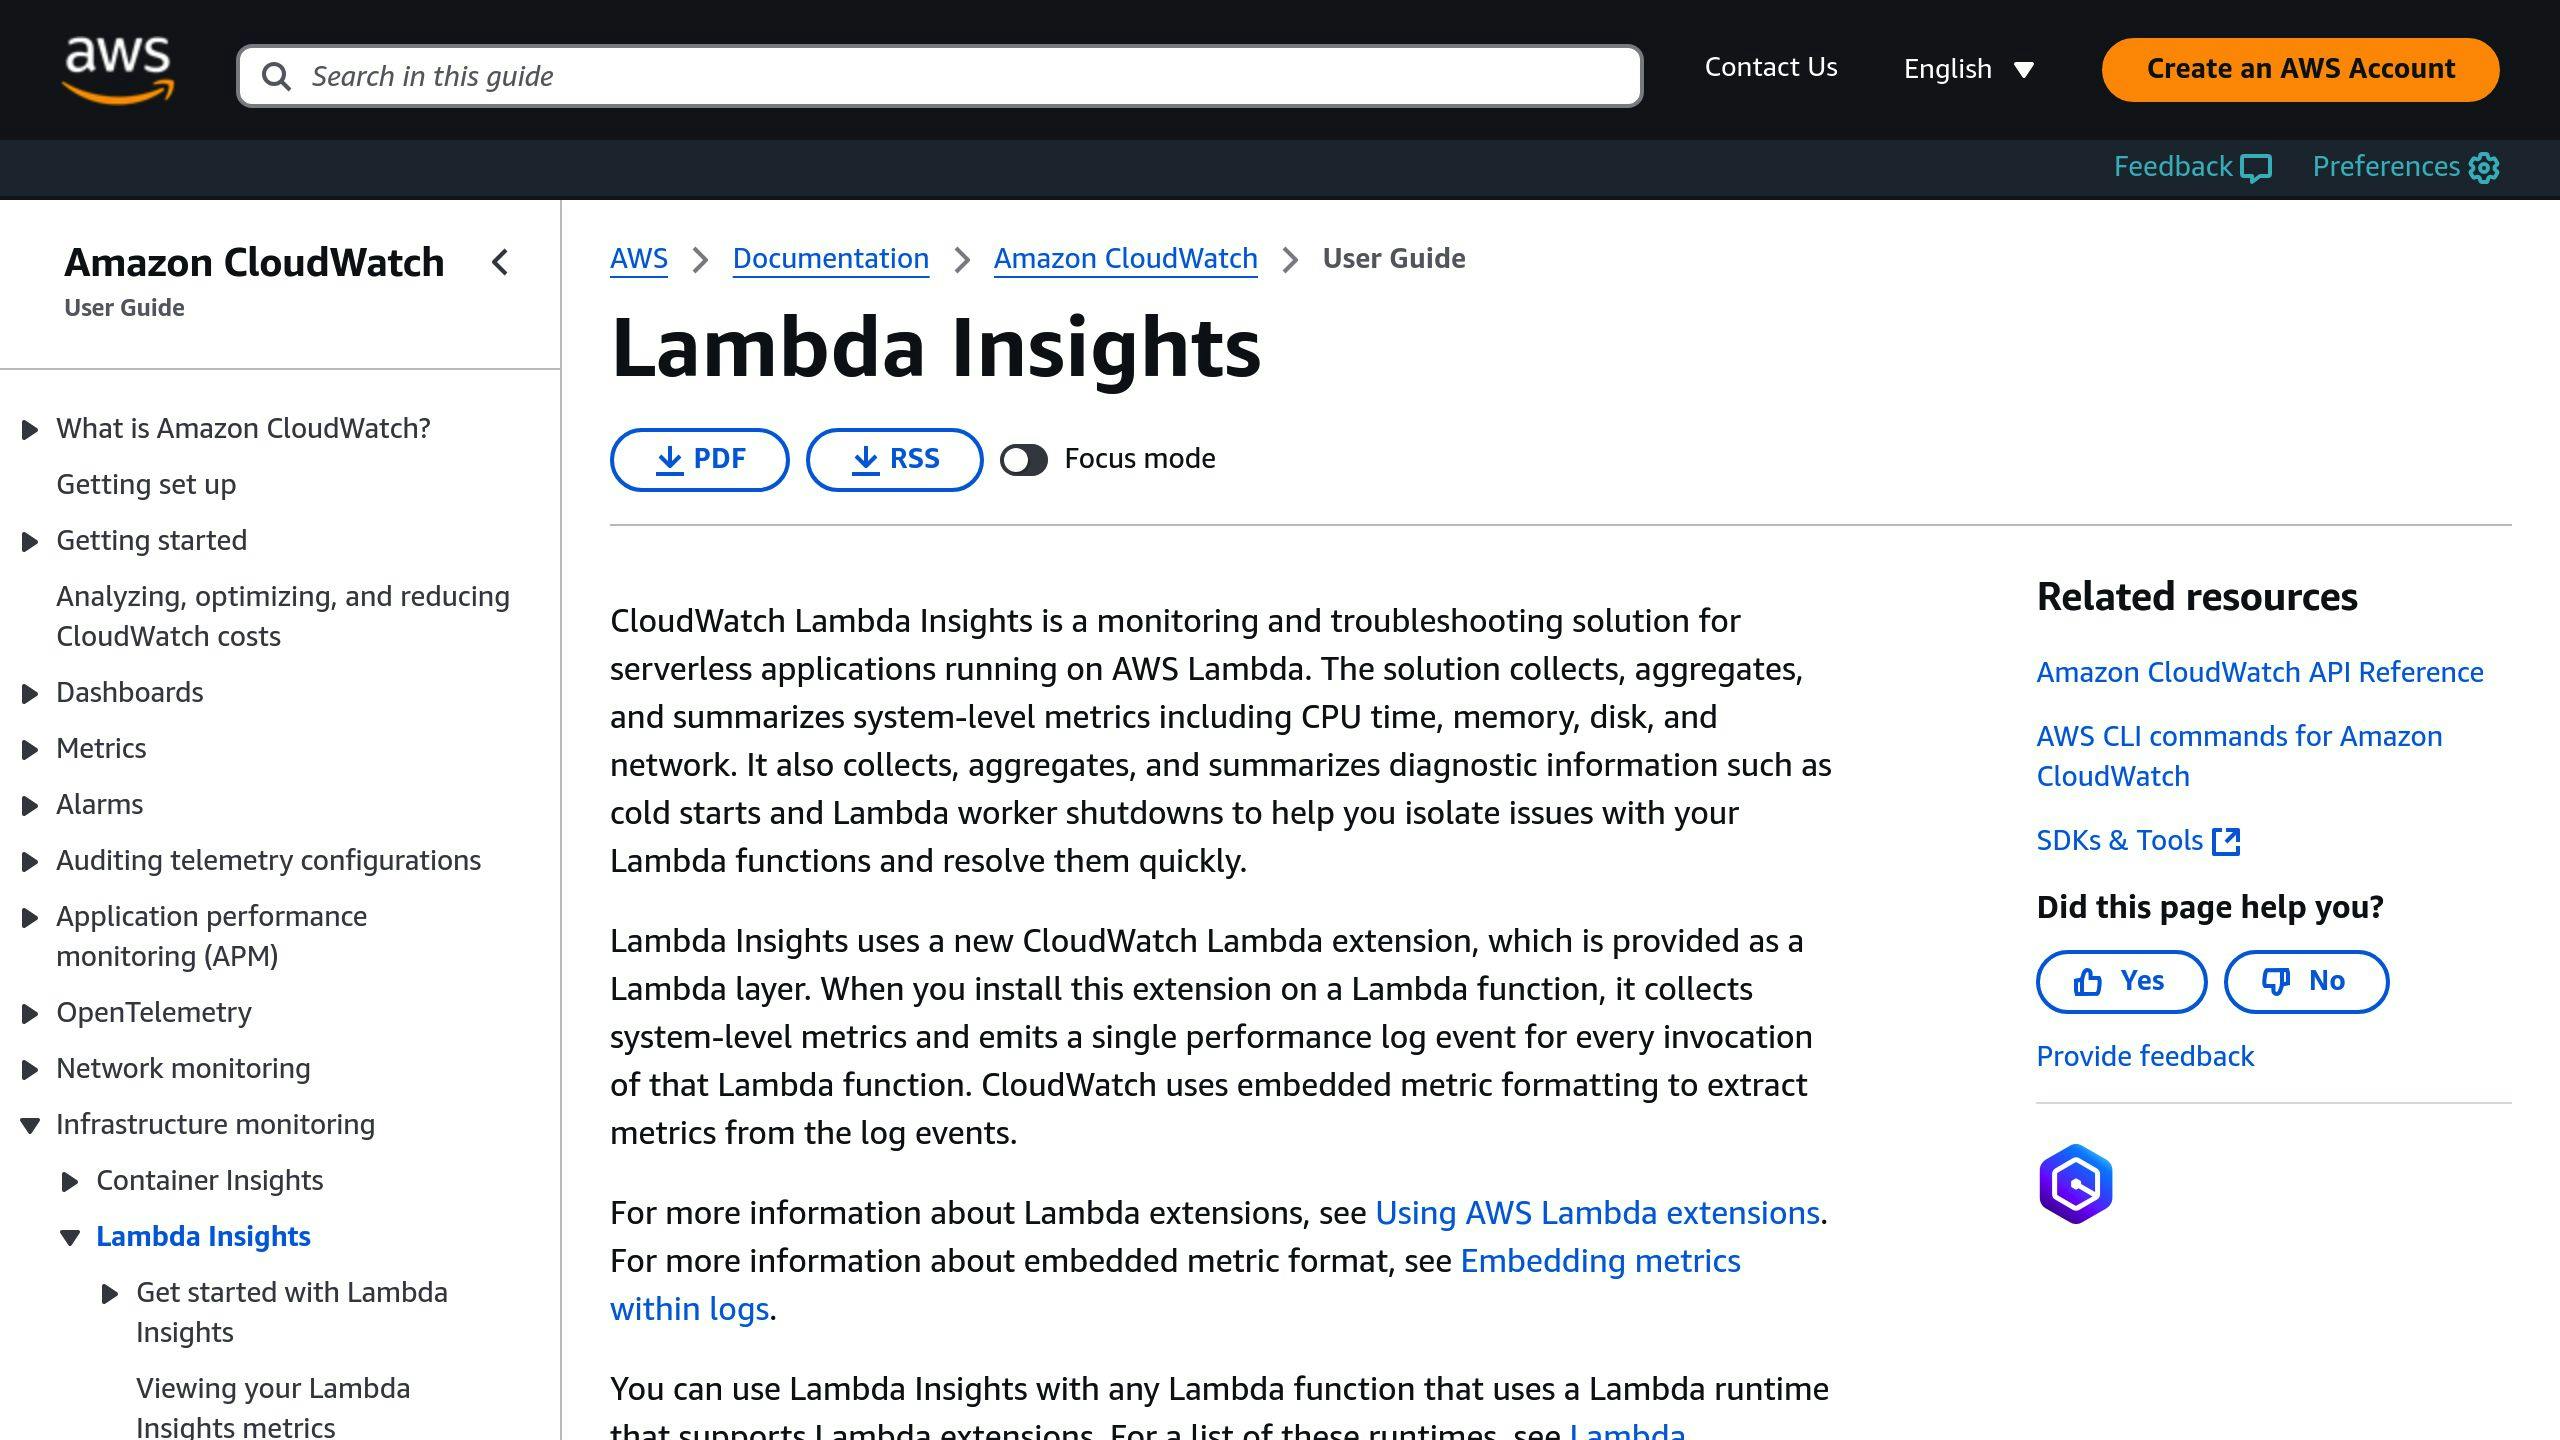
What are Lambda insights in CloudWatch?
Lambda Insights in CloudWatch is a monitoring and troubleshooting tool for serverless applications running on AWS Lambda. It collects and summarizes system-level metrics, such as CPU time, memory, disk, and network usage, as well as diagnostic information like cold starts and Lambda worker shutdowns. This helps you identify and resolve issues with your Lambda functions quickly.
How does Lambda Insights work?
| Feature | Description |
|---|---|
| Metric collection | Collects system-level metrics, such as CPU time, memory, disk, and network usage |
| Diagnostic information | Collects diagnostic information, such as cold starts and Lambda worker shutdowns |
| Troubleshooting | Helps identify and resolve issues with your Lambda functions |
By using Lambda Insights, you can gain a deeper understanding of your Lambda function's performance, identify bottlenecks, and optimize resources to improve overall application reliability and efficiency.