To monitor AWS Lambda errors effectively, use Amazon CloudWatch. It provides tools like Metrics and Logs to track errors, performance issues, and resource usage. Here's a quick rundown:
- CloudWatch Metrics: Automatically tracks error rates, invocation counts, execution duration, and throttles.
- CloudWatch Logs: Offers detailed logs for troubleshooting, including stack traces and error patterns.
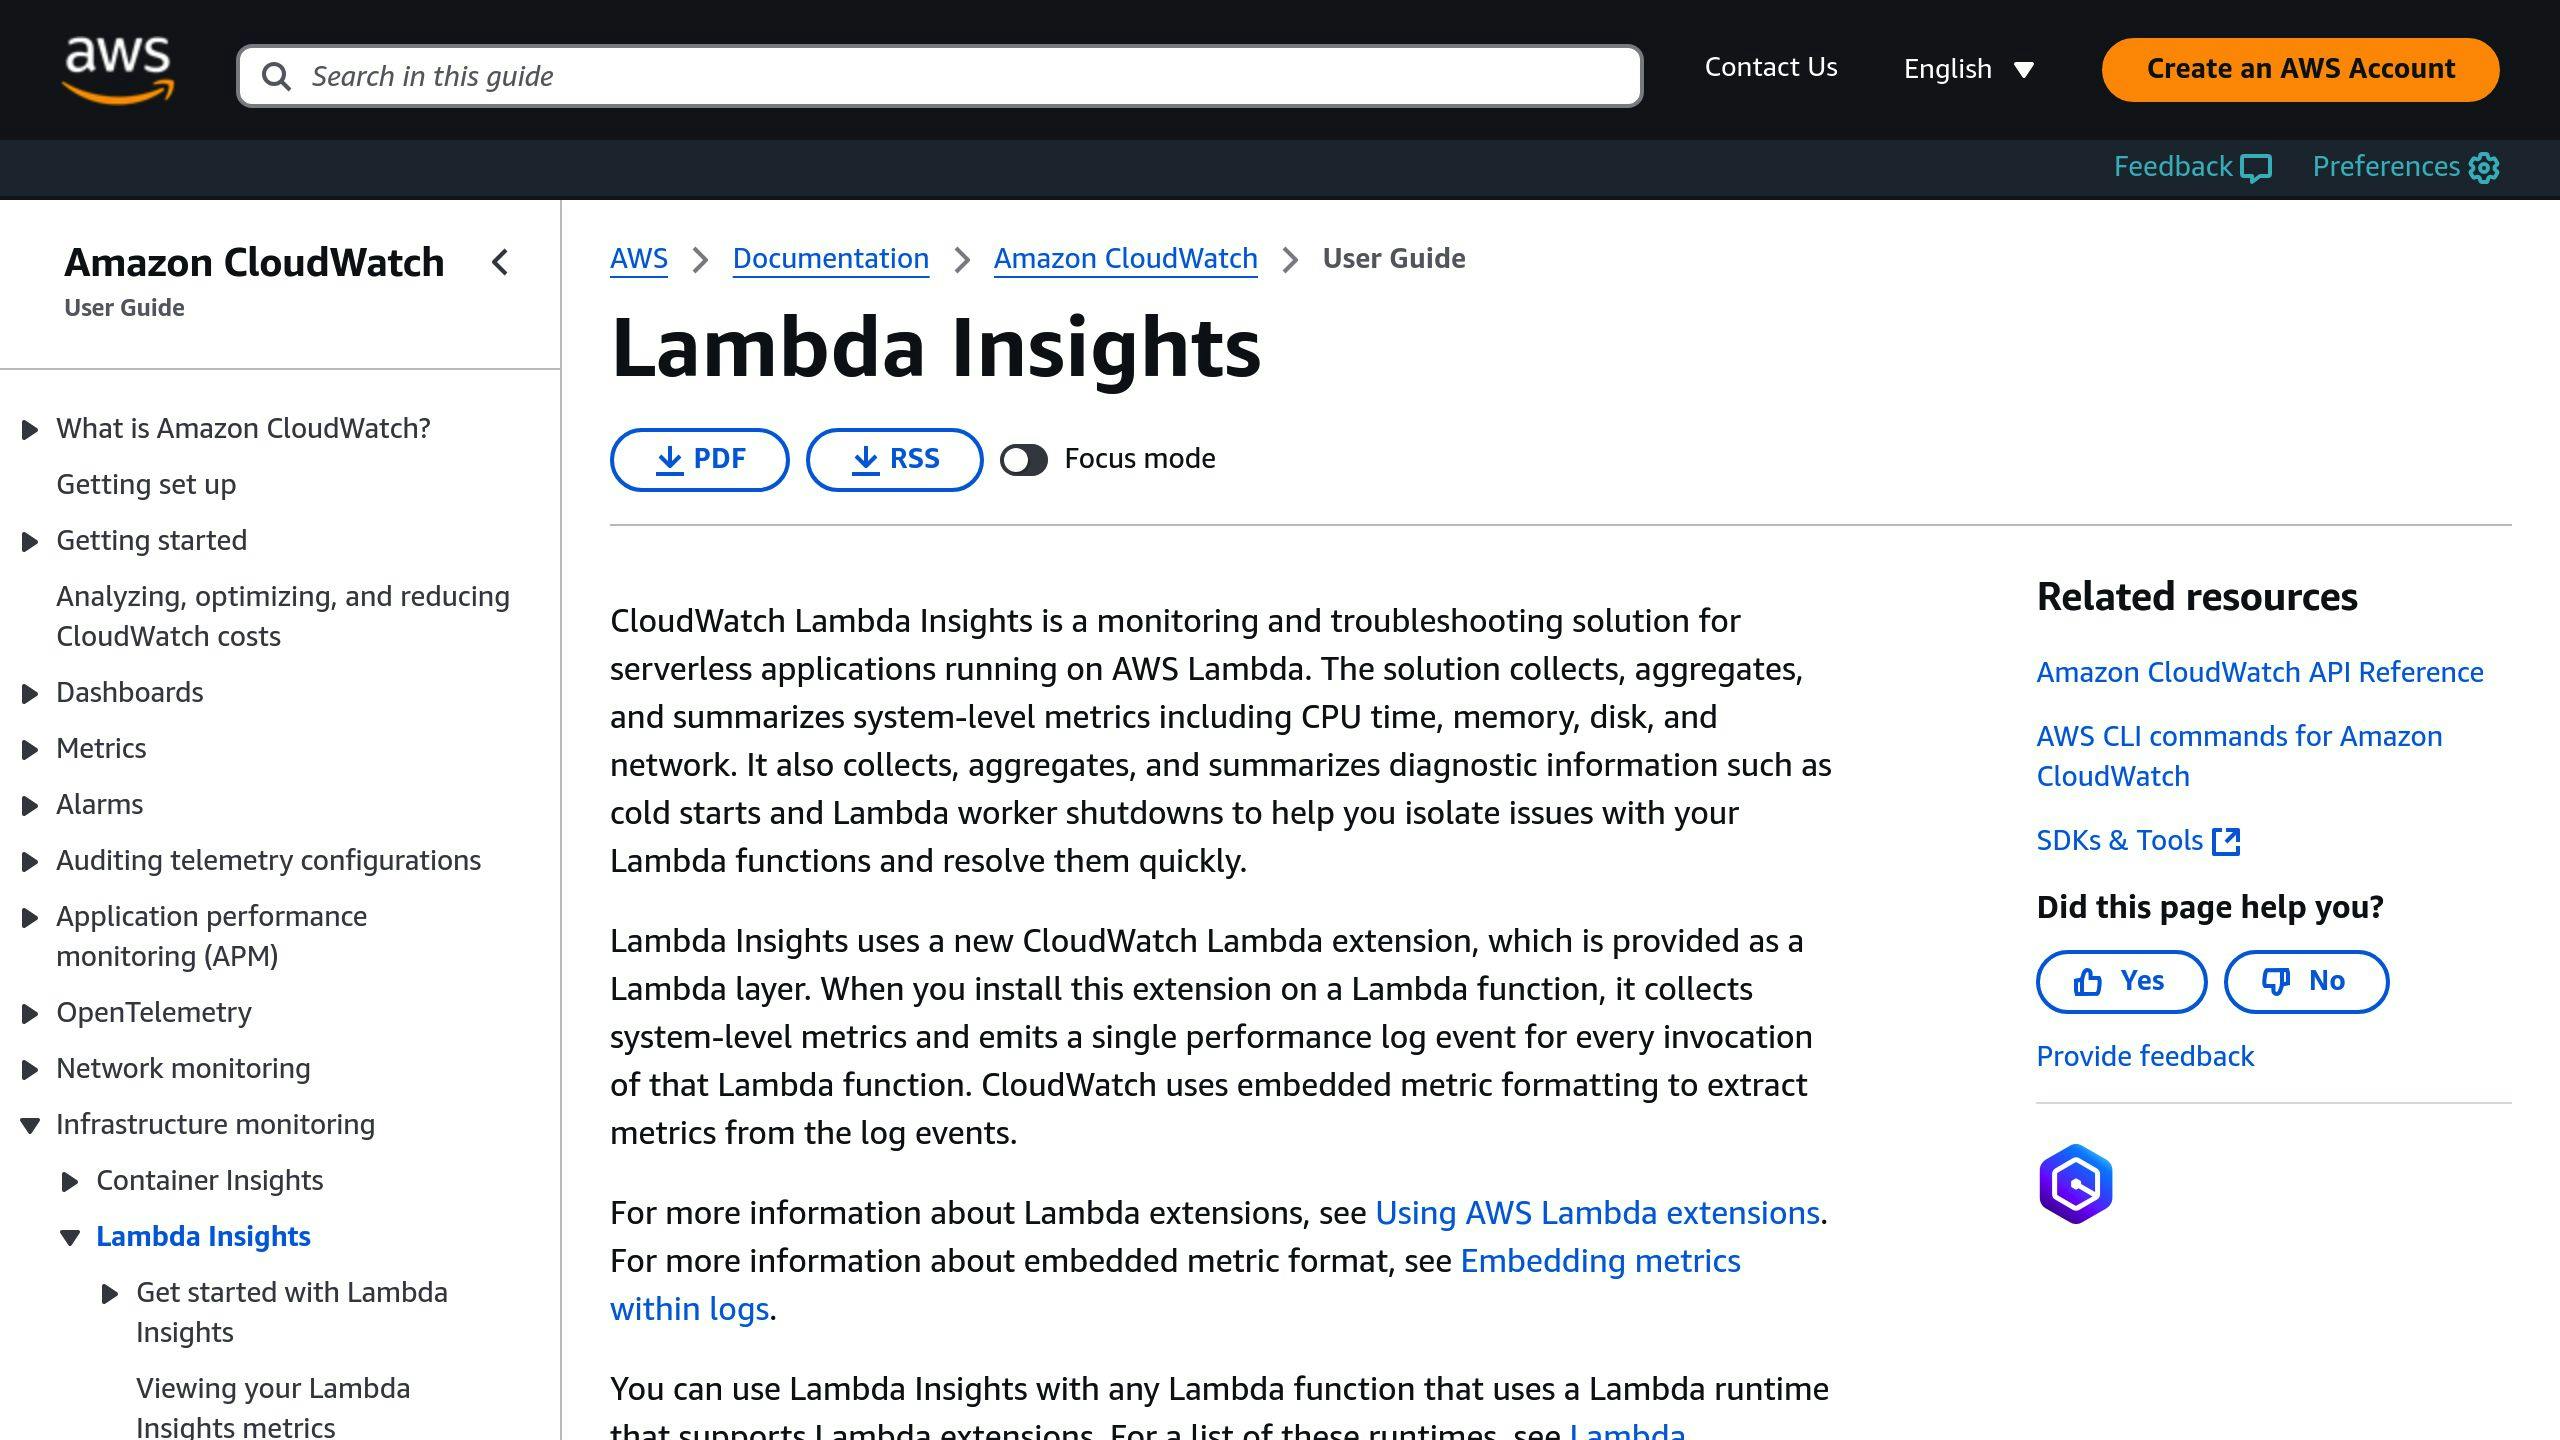
- Lambda Insights: Provides advanced monitoring with metrics like CPU usage, memory utilization, and runtime errors.
Key Steps:
- Use CloudWatch Metrics to set up alarms for error thresholds.
- Analyze logs with CloudWatch Logs Insights using queries to find patterns.
- Enable Lambda Insights for deeper performance analysis.
By combining these tools, you can set alerts, diagnose issues faster, and optimize your serverless applications' performance.
Related video from YouTube
How to Set Up CloudWatch for Lambda Errors
Monitoring Lambda errors with CloudWatch involves configuring metrics and setting up alarms. While CloudWatch metrics are automatically enabled for Lambda functions, you’ll need to customize settings to track errors effectively.
Accessing CloudWatch Metrics for Lambda
To view Lambda metrics, go to the CloudWatch console and navigate to Metrics > AWS Lambda namespace. Here are the key metrics to monitor:
- Errors: Tracks the number of failed function executions.
- Invocations: Shows the total number of times the function is called.
- Duration: Measures how long each invocation takes to execute.
- Throttles: Counts the number of rejected execution requests.
Make sure the IAM role assigned to your Lambda function includes permissions for logging actions, such as logs:CreateLogGroup and logs:PutLogEvents.
Setting Up CloudWatch Alarms
Alarms help you respond quickly to critical issues by notifying you when metrics exceed set thresholds. Here’s how to set them up:
- In the CloudWatch console, create an alarm for the Errors metric or use log filters to detect specific error patterns. Define thresholds based on your application's tolerance, like an error rate greater than 1%.
- Set up notification channels such as email, SMS, or AWS SNS. You can also automate responses by triggering AWS Lambda functions or other AWS services.
Using CloudWatch Logs to Analyze Lambda Errors
CloudWatch Logs offers detailed information about how your Lambda functions are executed, helping you pinpoint and fix errors. To get started, head to the CloudWatch console, select "Logs" from the navigation menu, and locate your function's log group under /aws/lambda/<function name>.
How to Access and Interpret CloudWatch Logs
Each log entry includes key details like the timestamp, request ID, log level, and message content. You can use CloudWatch Logs Insights to run SQL-like queries for quick analysis. For instance, to find the latest errors, try this query:
fields @timestamp, @message
| filter @message like /ERROR/
| sort @timestamp desc
| limit 20
This helps you quickly spot error patterns without manually sifting through logs.
Tips for Managing Logs Effectively
To streamline error detection, set up log filters that track specific patterns such as runtime exceptions, timeouts, or custom error messages. Pair these filters with metrics for a more thorough approach to catching issues.
When it comes to log retention, choose a period that aligns with your needs:
- 1 week for development environments
- 1 month for standard production setups
- 6 months for compliance requirements
- Indefinite for critical systems
Adopt clear naming conventions for log groups by including details like the environment and function type (e.g., /aws/lambda/prod-payment-processing). This makes it easier to organize and locate logs.
Keep in mind that CloudWatch Logs charges are based on the volume of logs and retention periods [2]. Regularly monitor your usage to balance cost efficiency with debugging needs.
For deeper insights into performance and error trends, tools like Lambda Insights can complement your log analysis efforts, giving you a broader view of your system's behavior.
sbb-itb-6210c22
Advanced Monitoring with CloudWatch Lambda Insights

CloudWatch Lambda Insights gives you a deeper look into the performance of your Lambda functions, providing detailed metrics to help you monitor and optimize them effectively.
How to Enable Lambda Insights
Here's how you can enable Lambda Insights using the Lambda Console:
- Navigate to your Lambda function.
- Go to the Configuration tab.
- Locate the section labeled Monitoring and operations tools.
- Click on Edit.
- Turn on Enhanced monitoring.
Once enabled, you'll gain access to detailed metrics such as:
| Metric Category | Details |
|---|---|
| Performance | CPU usage, memory utilization, network I/O |
| Errors | Runtime errors, timeouts, cold starts |
| Concurrency | Active instances, throttling data |
| Duration | Initialization time, execution time |
Monitoring Multiple Lambda Functions
To monitor multiple functions at once, head to CloudWatch > Insights > Lambda Insights and select Multi-function [1]. This dashboard provides:
- A consolidated view of performance metrics across all monitored functions
- Trends in error patterns
- Resource usage comparisons
- Data on concurrent executions
For a more complete picture, combine Lambda Insights with AWS X-Ray and CloudWatch Logs. This setup allows you to trace performance data back to specific error events, giving you end-to-end visibility into your application's behavior.
Keep in mind that using Lambda Insights can increase your CloudWatch costs. Regularly check your usage to ensure you're balancing expenses with the value of the insights provided [3].
With these tools in place, you're ready to explore best practices for optimizing your monitoring strategy.
Best Practices for Monitoring Lambda Functions
Building on the metrics and tools mentioned earlier, these tips can help improve your monitoring approach.
Reviewing Logs and Tracking Error Trends
Regularly reviewing logs and tracking errors is key to keeping your Lambda functions running smoothly. Use custom log filters to spot error patterns and CloudWatch Logs Insights for focused queries - like identifying functions close to timeout limits - to address issues before they escalate.
Here are a few essential components:
- Log Filters: Group errors by type, such as timeouts, memory problems, or runtime failures.
- Metrics Analysis: Keep an eye on invocation counts, error rates, and duration trends.
- Alert Thresholds: Set up early warning systems for limits that are about to be reached.
Creating Custom Metrics and Alerts
Custom metrics give you a closer look at how your Lambda functions perform. For instance, you can monitor specific business-related errors or track the success rates of external APIs. Set alarms based on normal behavior patterns to catch anomalies early. Important metrics to watch include error rates, execution duration, and memory usage.
For critical functions, implement multi-level alerts: set a warning at 70% memory usage and a critical alert at 90%. Use Lambda Insights to adjust thresholds and improve performance [3].
For more complex setups, design dashboards that combine standard and custom metrics to get a clear picture of overall Lambda health.
Additional Resources from AWS for Engineers
If you're looking to explore Lambda error monitoring in more detail, AWS for Engineers has you covered. Their tutorials, techniques, and examples are specifically designed for software engineers.
The blog focuses on three main topics:
- Error detection methods and implementation
- Setting up performance monitoring
- Configuring and fine-tuning alerts
These resources build on the CloudWatch monitoring strategies mentioned earlier, offering detailed guidance on:
- Creating custom CloudWatch metrics for Lambda
- Identifying and addressing error trends
- Using Lambda Insights for deeper monitoring capabilities
Each guide provides step-by-step instructions and real-world examples to help you apply advanced monitoring techniques. The blog also expands on AWS-recommended practices, making it easier to implement effective solutions.
The Lambda monitoring section on AWS for Engineers closely ties into the CloudWatch strategies discussed here, giving you practical tools to enhance error tracking and performance monitoring. These materials are a great way to build more reliable and scalable systems.
Conclusion
Keeping a close eye on Lambda errors using CloudWatch is key to running dependable serverless applications. By using a mix of metrics, logs, and insights, you can set up a monitoring system that cuts down on resolution time and keeps your application running smoothly.
CloudWatch provides multiple layers of monitoring through its metrics, logs, and insights. Activating CloudWatch metrics, configuring specific alarms, and using Lambda Insights allows development teams to identify and address issues quickly. These tools work together to maintain consistent performance with detailed data and timely alerts.
To improve your setup, refine custom metrics and automate error detection processes. Lambda Insights plays a crucial role by simplifying troubleshooting and offering in-depth metrics to pinpoint issues.
Keep evolving your monitoring strategy and stay informed about new AWS features to meet changing application demands. These approaches, along with resources like AWS for Engineers, can help you build and maintain reliable serverless systems.


