Want to monitor your AWS Lambda functions effectively? Setting up Amazon CloudWatch alarms is the key. These alarms help you track critical metrics like errors, execution time, and throttling, ensuring your serverless applications run smoothly. Here's a quick overview of what you'll learn:
- Key Metrics to Monitor: Track invocations, errors, execution time, and concurrency to identify issues early.
- Alarm Setup: Choose metrics, set thresholds, and configure notifications for real-time alerts.
- Advanced Features: Use tools like anomaly detection and metric math for precise monitoring.
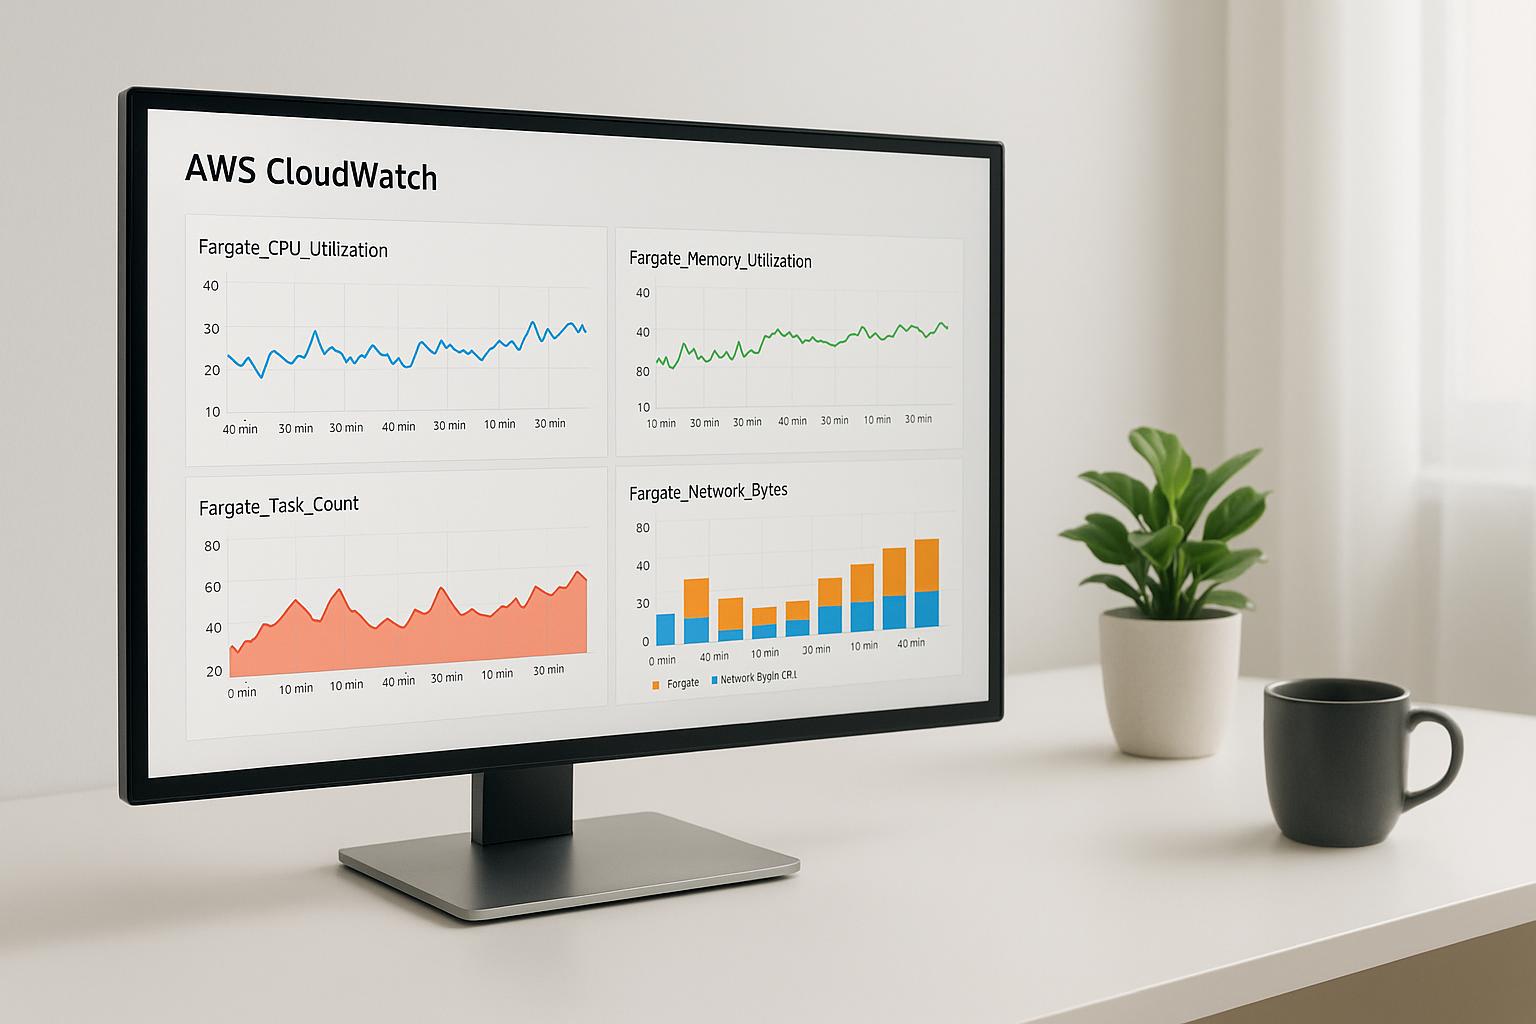
Lambda Metrics to Track
Amazon CloudWatch offers several metrics to help monitor the performance and stability of your Lambda functions. These metrics play a key role in setting up alarms to ensure your functions run efficiently.
Function Calls
The Invocations metric tracks how many times your Lambda function is executed every minute. This is essential for understanding usage patterns and managing costs.
To get an accurate total of function calls, use the Sum statistic when analyzing this metric.
Error Rates
The Errors metric counts the number of failed function calls, whether caused by code issues or runtime problems. To assess the error rate, use this formula:
Error Rate = Errors / Invocations
Additionally, keep an eye on DeadLetterErrors and DestinationDeliveryFailures for more details on failed executions.
Execution Time
The Duration metric measures how long your function takes to process an event. Since AWS charges based on milliseconds, reviewing the Average or Max values can help identify bottlenecks or inefficiencies. Note that exceeding the timeout limit will result in failures.
Throttling Events
The Throttles metric shows when invocations are rejected due to concurrency limits being hit. Set alarms if throttling events exceed your acceptable thresholds.
Active Functions
The ConcurrentExecutions metric tracks how many function instances are running simultaneously to process events. Use the Max statistic to ensure concurrency stays within your configured limits.
| Metric Type | Key Metric | Recommended Statistic | Purpose |
|---|---|---|---|
| Invocation | Invocations | Sum | Track usage |
| Performance | Duration | Average/Max | Analyze processing time |
| Errors | Errors | Sum | Monitor reliability |
| Concurrency | ConcurrentExecutions | Max | Evaluate resource usage |
| Throttling | Throttles | Sum | Plan for capacity needs |
These metrics will help you fine-tune your alarm thresholds in the next steps.
Setting Up Lambda Alarms
Opening CloudWatch
Start by accessing the CloudWatch console through the AWS Management Console. Once inside, go to the "Alarms" section from the left-hand menu and click on "Create alarm." This will take you to the setup page where you can begin selecting the Lambda metrics you want to monitor.
Choosing Metrics
From the metrics namespace, select "Lambda" to see all the relevant metrics for your functions. Here are some key metrics to consider:
| Metric Category | Recommended Alert Threshold | Common Use Case |
|---|---|---|
| Error Rate | > 1% of total invocations | Production APIs |
| Duration (p95) | > 3 seconds | User-facing functions |
| Concurrent Executions | > 80% of regional limit | High-traffic services |
| DLQ Errors | > 0 | Critical data processing |
Choose the metrics that align with your service's needs to ensure you're monitoring the right performance indicators.
Setting Thresholds
Once you've picked your metrics, configure alarm conditions based on statistical measures:
- Statistic: Choose Sum, Average, or Max based on the metric type.
- Period: Set the time interval, typically 1-minute for Lambda metrics.
- Condition Type: Options include Greater/Less than or Greater/Less than or equal to.
- Threshold Value: Define a value that reflects your service's requirements.
For instance, if you want to track errors, you can set the condition to "Greater than 0" for the Errors metric, using the Sum statistic over a 5-minute period.
Adding Notifications
Set up notifications to receive alerts via Amazon SNS:
- Create a new SNS topic or use an existing one.
- Add subscription endpoints, such as email, SMS, or HTTP.
- Specify which alarm states (OK, ALARM, INSUFFICIENT_DATA) will trigger notifications.
"CloudWatch Logs subscriptions let you match entries with a particular error pattern in your log and be notified with those error details. This saves you an extra step to parse through the logs and take necessary action." - AWS Cloud Operations Blog
For more advanced notifications, you can create a metric filter to monitor specific error patterns in your Lambda logs. This lets you set up alerts based on log content instead of just metric values.
sbb-itb-6210c22
Advanced Alarm Options
Expanding beyond basic alarm setups, advanced options allow for more precise monitoring of complex Lambda functions.
Metric Math Alarms
Metric math alarms help you track intricate relationships between multiple Lambda metrics. You can combine up to 10 metrics into a single formula to create detailed alarm conditions.
Here’s how to set up a metric math alarm:
- Select the base metrics you want to monitor.
- In the CloudWatch console, click "Add a math expression".
- Define your mathematical formula.
- Assign clear IDs to each metric for easy reference.
- Choose the final math expression as the basis for your alarm.
| Component | Expression | Description |
|---|---|---|
| Metric 1 (m1) | Errors | Number of function errors |
| Metric 2 (m2) | Invocations | Total function calls |
| Math Expression | (m1/m2) * 100 | Error rate as a percentage |
In addition to math expressions, CloudWatch offers statistical tools to detect unusual trends in metrics.
Anomaly Detection
CloudWatch anomaly detection uses historical data to create a statistical model of expected Lambda metric values. It identifies normal patterns by analyzing hourly, daily, and weekly trends.
Key settings to configure:
| Setting | Description | Suggested Configuration |
|---|---|---|
| Threshold Band | Range of normal values | Set to 2 standard deviations |
| Training Period | Time for model learning | At least 2 weeks for accuracy |
| Evaluation Period | How often checks occur | Use 1-minute intervals |
This method helps you spot deviations from typical behavior effectively.
Multi-Metric Alarms
Multi-metric alarms combine multiple conditions for a more comprehensive monitoring approach. Metrics like error rates, execution times, and concurrency levels can be grouped to trigger alerts only when specific combinations of abnormal conditions occur.
When setting up multi-metric alarms, focus on combinations that align with your application's real-world failure scenarios. This strategy offers a broader view of system health by monitoring key metrics together rather than in isolation.
Tips and Common Issues
Threshold Guidelines
Set alarm thresholds using Lambda performance data as a baseline. Leverage CloudWatch's suggestions and adjust thresholds as needed to handle fluctuating workloads. Keep an eye on key metrics like error rates, execution duration, and throttling events to ensure your alarms stay relevant.
Troubleshooting Steps
Once you've set up thresholds, confirm your alarms are working correctly by following these steps:
- Check Lambda metrics in CloudWatch Logs.
- Review SNS notification settings in your SNS Topics.
- Make sure the alarm's evaluation period aligns with your Lambda's execution patterns.
For more precise error tracking, consider setting up custom metrics to capture specific error behaviors.
Alarm Testing
Test alarms by simulating different scenarios. For example:
- Trigger forced errors to evaluate how alarms handle 5XX responses and ensure SNS notifications are sent.
- Simulate 4XX responses to test API Gateway alarms.
Use evaluation periods that reflect your Lambda traffic patterns, and choose appropriate statistics, like Sum for error tracking.
"CloudWatch Logs subscriptions let you match entries with a particular error pattern in your log and be notified with those error details. This saves you an extra step to parse through the logs and take necessary action." - AWS Cloud Operations Blog
Summary
Setting up CloudWatch alarms for Lambda functions is a key step in maintaining reliable serverless operations. CloudWatch keeps an eye on critical metrics like errors, function duration, throttling events, and invocation counts. By configuring thresholds and notifications, you can address potential issues before they escalate.
Key areas to monitor include:
- Concurrent executions: Aim to stay around 80% of the regional limit.
- Dead-letter queue errors: Set a zero-tolerance policy for these errors.
- Function durations: Ensure these align with your SLA requirements.
- Custom metric filters: Use these to detect specific error patterns.
For added functionality, integrate with SNS to receive alerts on state changes. Features like metric math and anomaly detection allow for more advanced monitoring setups.
As Taavi Rehemägi notes:
"Although you can't fully understand what's happening just with CloudWatch alone, it is a great place to start and have it as the first line of defense for ensuring service availability and performance." - Taavi Rehemägi