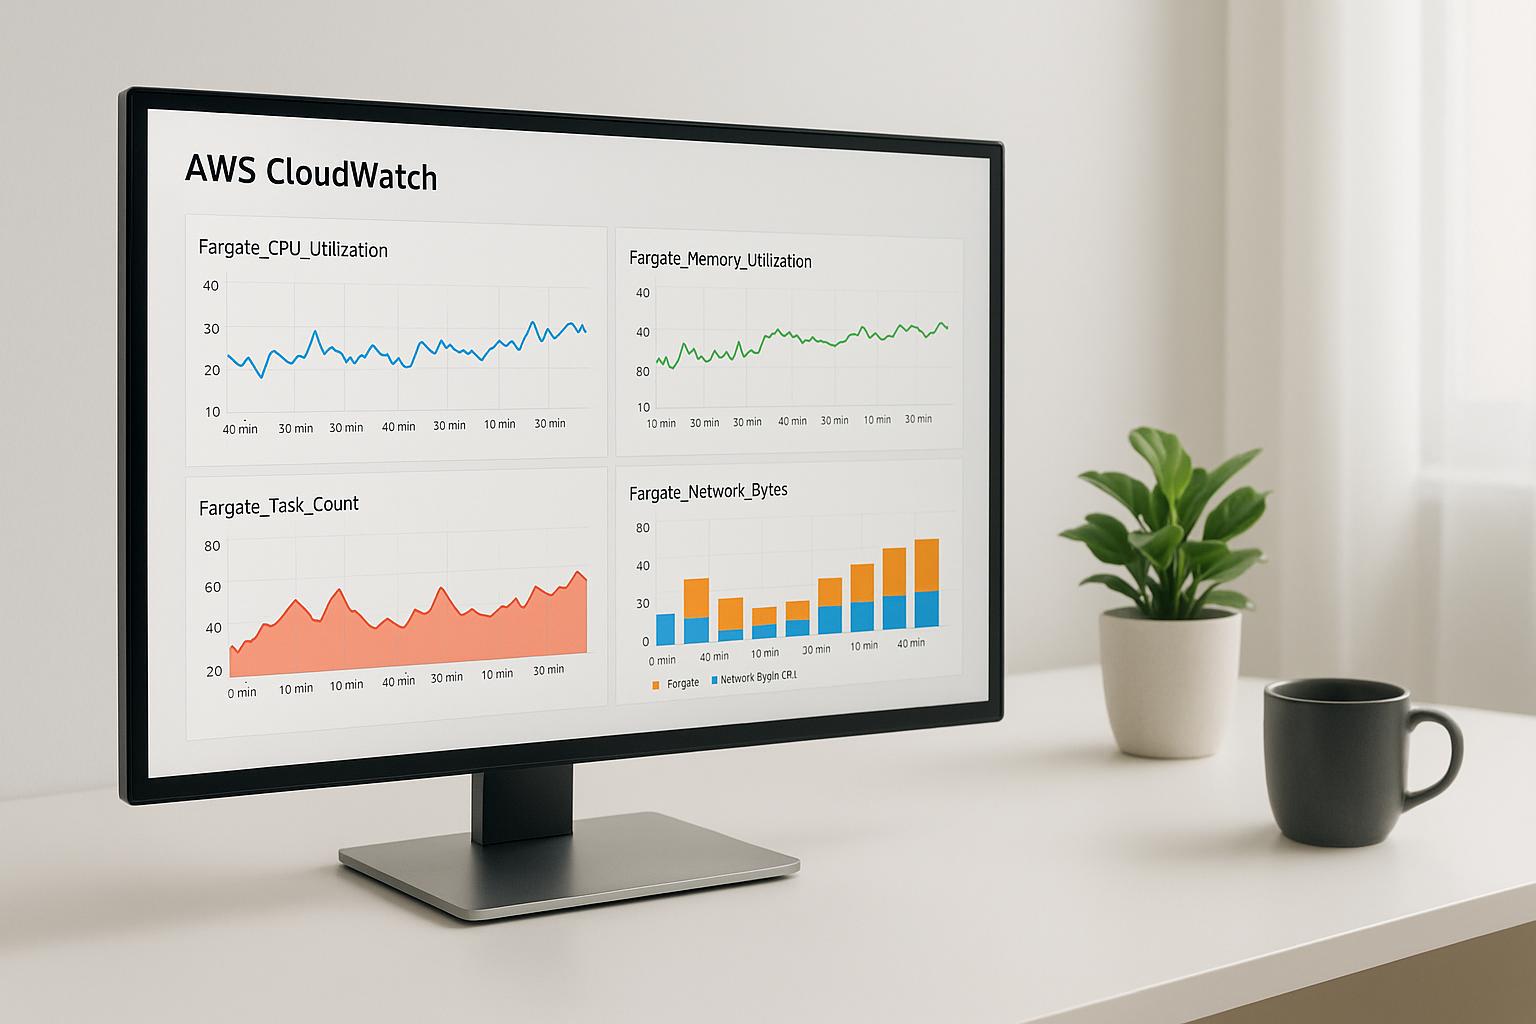
Want to keep your EC2 instances running smoothly? Amazon CloudWatch makes it easy to monitor performance, detect issues, and automate responses. Here's what you'll learn in this guide:
- Key Metrics: Track CPU, memory, disk, and network usage.
- Setup Steps: Enable detailed monitoring, configure IAM roles, and install the CloudWatch agent.
- Alerts: Create alarms for early issue detection and automated responses.
- Dashboards: Build visual dashboards to monitor performance trends.
Quick Start: Enable detailed monitoring for 1-minute intervals, set up alarms for high CPU usage, and use dashboards to track metrics in real-time. This ensures your EC2 instances stay reliable and efficient.
Let’s dive into how you can set this up step-by-step.
CloudWatch Setup for EC2
To set up CloudWatch for your EC2 instance, you'll need to enable detailed metrics, configure IAM roles, and install the CloudWatch agent. Here's how to do it:
Enable Detailed Metrics
Detailed monitoring offers EC2 metrics at 1-minute intervals instead of the default 5-minute intervals. Here's how you can enable it:
- Using the AWS Console: Go to the EC2 Dashboard, select your instance, and navigate to Actions > Monitoring > Manage Detailed Monitoring.
-
Using the AWS CLI: Run the following command:
aws ec2 monitor-instances --instance-ids i-1234567890abcdef0
Keep in mind that enabling detailed monitoring may incur additional costs. Check the AWS pricing page for details.
Set Up IAM Access
To allow CloudWatch to function properly, create and attach an IAM role with the necessary permissions. Below are the required policies and their purposes:
| Permission Policy | Purpose | Required Actions |
|---|---|---|
| CloudWatchAgentServerPolicy | Enables sending metrics | cloudwatch:PutMetricData |
| AmazonSSMManagedInstanceCore | Allows agent management | ssm:GetParameter, ssm:PutParameter |
| CloudWatchAgentAdminPolicy | Supports configuration retrieval | cloudwatch:GetMetricStatistics |
Steps to attach the role to an EC2 instance:
- Open the IAM Console.
- Create a new role for EC2.
- Attach the required policies listed above.
- Assign the role to your EC2 instance.
Once the role is in place, you're ready to install the CloudWatch agent.
Install CloudWatch Agent
The CloudWatch agent collects additional system-level metrics like memory and disk usage. Follow these steps to install it on an Amazon Linux instance:
-
Download and install the agent:
wget https://s3.amazonaws.com/amazoncloudwatch-agent/amazon_linux/amd64/latest/amazon-cloudwatch-agent.rpm sudo rpm -U amazon-cloudwatch-agent.rpm -
Configure the agent: Create a configuration file (e.g.,
/opt/aws/amazon-cloudwatch-agent/bin/config.json) with content like this:{ "metrics": { "metrics_collected": { "mem": { "measurement": ["mem_used_percent"] }, "disk": { "measurement": ["disk_used_percent"] } } } } -
Start the agent:
sudo /opt/aws/amazon-cloudwatch-agent/bin/amazon-cloudwatch-agent-ctl -a fetch-config -m ec2 -s -c file:/opt/aws/amazon-cloudwatch-agent/bin/config.json
To ensure the agent is running correctly, check its status with:
sudo /opt/aws/amazon-cloudwatch-agent/bin/amazon-cloudwatch-agent-ctl -m ec2 -a status
EC2 CloudWatch Alarms
Once you've set up CloudWatch for your EC2 instances, creating alarms can help you automatically monitor and address performance issues. Here's a guide to setting up effective CloudWatch alarms for your EC2 instances.
Select Alarm Metrics
Pick metrics that directly affect your application's performance and stability. Key EC2 metrics to monitor include:
| Metric Category | Key Metrics | Recommended Threshold |
|---|---|---|
| CPU | CPUUtilization | 80% sustained for 5 minutes |
| Memory | MemoryUtilization | 85% sustained for 5 minutes |
| Disk | DiskSpaceUtilization | 90% of available space |
| Status | StatusCheckFailed | Any failure for 2 minutes |
Tailor these thresholds to your application's demands. For instance, if you're running a CPU-heavy app, you might need a stricter CPU threshold than for a memory-focused one.
Configure Alarm Rules
Set up alarm rules to ensure a balance between quick responses and avoiding false alarms. Focus on these parameters:
1. Evaluation Period
Choose an evaluation period that minimizes false positives. For example, to trigger an alarm when CPU usage exceeds 80% for 5 minutes, use this configuration:
{
  "MetricName": "CPUUtilization",
  "Period": 300,
  "EvaluationPeriods": 1,
  "Threshold": 80,
  "ComparisonOperator": "GreaterThanThreshold"
}
This setup ensures the alarm activates only if CPU utilization remains above 80% for a full 5-minute period.
2. Threshold Actions
Define automated actions for when thresholds are breached. These might include:
- Scaling instances up or down with Auto Scaling policies
- Running AWS Lambda functions
- Starting or stopping EC2 instances
- Sending notifications to your team
3. Recovery Actions
Prepare for hardware issues by configuring instance recovery. For example, to automatically recover an instance failing a system status check, use this setup:
{
  "MetricName": "StatusCheckFailed_System",
  "AlarmActions": [
    "arn:aws:automate:us-east-1:ec2:recover"
  ]
}
Set Up SNS Alerts
To stay informed about alarms, use Amazon SNS for notifications via email, SMS, or other channels. Here's how:
- Create an SNS Topic:
aws sns create-topic --name EC2-Alerts
- Add Subscribers:
aws sns subscribe \
  --topic-arn arn:aws:sns:us-east-1:123456789012:EC2-Alerts \
  --protocol email \
  --notification-endpoint team@example.com
- Link the Alarm to SNS:
aws cloudwatch put-metric-alarm \
  --alarm-name CPU-Critical \
  --alarm-actions arn:aws:sns:us-east-1:123456789012:EC2-Alerts
For critical systems, consider adding multiple notification methods or integrating with incident management tools to ensure alerts reach your team promptly.
sbb-itb-6210c22
EC2 Monitoring Dashboards
CloudWatch dashboards offer a centralized way to keep track of your EC2 metrics, helping you oversee EC2 performance efficiently.
Build Basic Dashboards
You can create a dashboard using the AWS Console or the AWS CLI. Here's an example using the CLI:
aws cloudwatch put-dashboard \
  --dashboard-name "EC2-Production" \
  --dashboard-body file://dashboard.json
Define the layout of your dashboard in a JSON file, like this:
{
  "widgets": [
    {
      "type": "metric",
      "width": 12,
      "height": 6,
      "properties": {
        "metrics": [
          ["AWS/EC2", "CPUUtilization", "InstanceId", "i-1234567890abcdef0"]
        ],
        "period": 300,
        "stat": "Average",
        "region": "us-east-1",
        "title": "CPU Utilization"
      }
    }
  ]
}
Add Metric Widgets
Widgets let you visualize key metrics in different formats. Here are some common widget types and their uses:
| Widget Type | Best Use Case | Recommended Metrics |
|---|---|---|
| Line Graph | Time-series data | CPU, Memory, Network |
| Number | Current status | Instance count, Error rate |
| Gauge | Resource usage | Disk usage, CPU % |
| Text | Notes or alerts | Instance details, alerts |
For example, you can include multiple metrics in a widget to monitor your EC2 instances more effectively:
{
  "metrics": [
    ["AWS/EC2", "CPUUtilization"],
    ["AWS/EC2", "NetworkIn"],
    ["AWS/EC2", "NetworkOut"],
    ["AWS/EC2", "DiskReadOps"],
    ["AWS/EC2", "DiskWriteOps"]
  ]
}
Manage Multiple Instances
When monitoring multiple instances, use these strategies to keep your dashboards organized and effective:
1. Dynamic Instance Selection
Use wildcards to create widget groups that automatically include new instances:
{
  "metrics": [
    ["AWS/EC2", "CPUUtilization", "AutoScalingGroupName", "prod-web-*"]
  ]
}
2. Group by Resource Tags
Assign tags to your instances based on their role or environment, then build dashboard sections based on those tags:
{
  "metrics": [
    ["AWS/EC2", "CPUUtilization",
     {"tag:Environment": "Production", "tag:Role": "WebServer"}]
  ]
}
3. Organize by Priority
Break down metrics into categories by importance:
- Critical Metrics: CPU, Memory, Status Checks
- Performance Metrics: Network I/O, Disk Operations
- Cost Metrics: EBS IOPS, Network Transfer
These approaches help you streamline monitoring across multiple EC2 instances.
EC2 Monitoring Guidelines
Fine-tune your monitoring approach by incorporating these tips alongside your CloudWatch setup.
Key Metrics to Track
Monitor EC2 metrics that provide insights into system health and performance. Use historical data and workload specifics to set thresholds effectively. Here are some key metrics to focus on:
| Metric Category | Example Metrics | Threshold Strategy |
|---|---|---|
| System Health | CPU Utilization, Memory Usage, Status Checks | Base thresholds on historical performance data |
| Performance | Disk I/O, Network Throughput, Disk Queue Length | Set limits according to instance capacity and demand |
To improve alert accuracy, use composite alarms that combine multiple metrics. This ensures more dependable notifications and better alarm configurations.
Minimize False Alarms
Keep alerts relevant by reducing false alarms. Use dynamic thresholds informed by historical patterns, and require multiple consecutive breaches before triggering an alarm. This approach helps filter out short-term spikes that don't point to real issues.
Control Monitoring Costs
Strike a balance between detailed monitoring and cost efficiency. Apply basic monitoring for less critical instances and reserve detailed monitoring for key ones. Save costs by filtering out non-essential metrics and using metric math to aggregate data. These practices can help you optimize your alarms and dashboards without overspending.
Conclusion
Summary
Monitoring EC2 instances with CloudWatch requires attention to detailed metrics, timely alarms, and well-designed dashboards. Success hinges on proper setup and following best practices. By keeping an eye on key metrics like CPU utilization, memory usage, and disk I/O, you can fine-tune performance while keeping costs under control.
CloudWatch alarms are essential for detecting performance issues early, helping to prevent system slowdowns and downtime. A centralized dashboard makes it easy to spot trends across instances and address bottlenecks quickly.
Additional Resources
Looking to improve your monitoring strategy? Check out these resources tailored to software engineers. AWS for Engineers offers in-depth guides, tutorials, and tools to help you master CloudWatch setup, alarm creation, and dashboard customization. Their content is updated regularly to ensure you're always using the latest techniques.
| Resource Type | Description | Focus Area |
|---|---|---|
| Blog Posts | Technical guides and tutorials | CloudWatch setup and configuration |
| Video Courses | Step-by-step instruction | EC2 monitoring and optimization |
| Practice Guides | Hands-on exercises | Performance tuning and cost control |
Visit AWS for Engineers for more resources on building cloud solutions and optimizing AWS infrastructure. Their developer-focused content offers practical tips for solving common monitoring challenges and growing your AWS expertise.


