AWS Fargate simplifies containerized application deployment by removing server management, while CloudWatch enables you to monitor performance through detailed metrics. Key metrics like CPU usage, memory consumption, and network activity help ensure smooth operations. CloudWatch's Container Insights offers deeper visibility into your tasks, clusters, and services, with features like custom dashboards, alarms, and autoscaling.
Quick Takeaways:
- Core Metrics: CPU usage, memory consumption, EBS filesystem usage, and running task count.
- Setup Steps: Enable Container Insights via the ECS console or CLI and configure IAM permissions.
- Custom Monitoring: Fine-tune metrics using custom dimensions or log-based tracking.
- Dashboards & Alarms: Visualize trends and set alerts for critical thresholds.
Use these tools to monitor Fargate workloads effectively, optimize resource usage, and maintain high application performance.
Setting Up CloudWatch for Fargate Metrics
Getting CloudWatch ready for monitoring Fargate tasks starts with a few essential steps. Once these are squared away, setting up detailed monitoring becomes a lot simpler. Begin by ensuring all prerequisites are met before diving into the configuration.
Prerequisites for CloudWatch and Fargate
Before you start configuring CloudWatch, make sure everything you need is in place. First, your AWS account should have the right IAM permissions. Key permissions include ecs:CreateCluster, ecs:DescribeClusters, and cloudwatch:PutMetricData. These are crucial for basic operations.
You’ll also need an active ECS cluster and task definitions with appropriate CPU and memory allocations. These resource settings are critical for calculating utilization percentages accurately. If your tasks are under-allocated, metrics might be inaccurate, or the tasks could fail to run.
Lastly, ensure you have access to the AWS Management Console or AWS CLI with valid credentials to manage configurations.
Enabling CloudWatch Container Insights
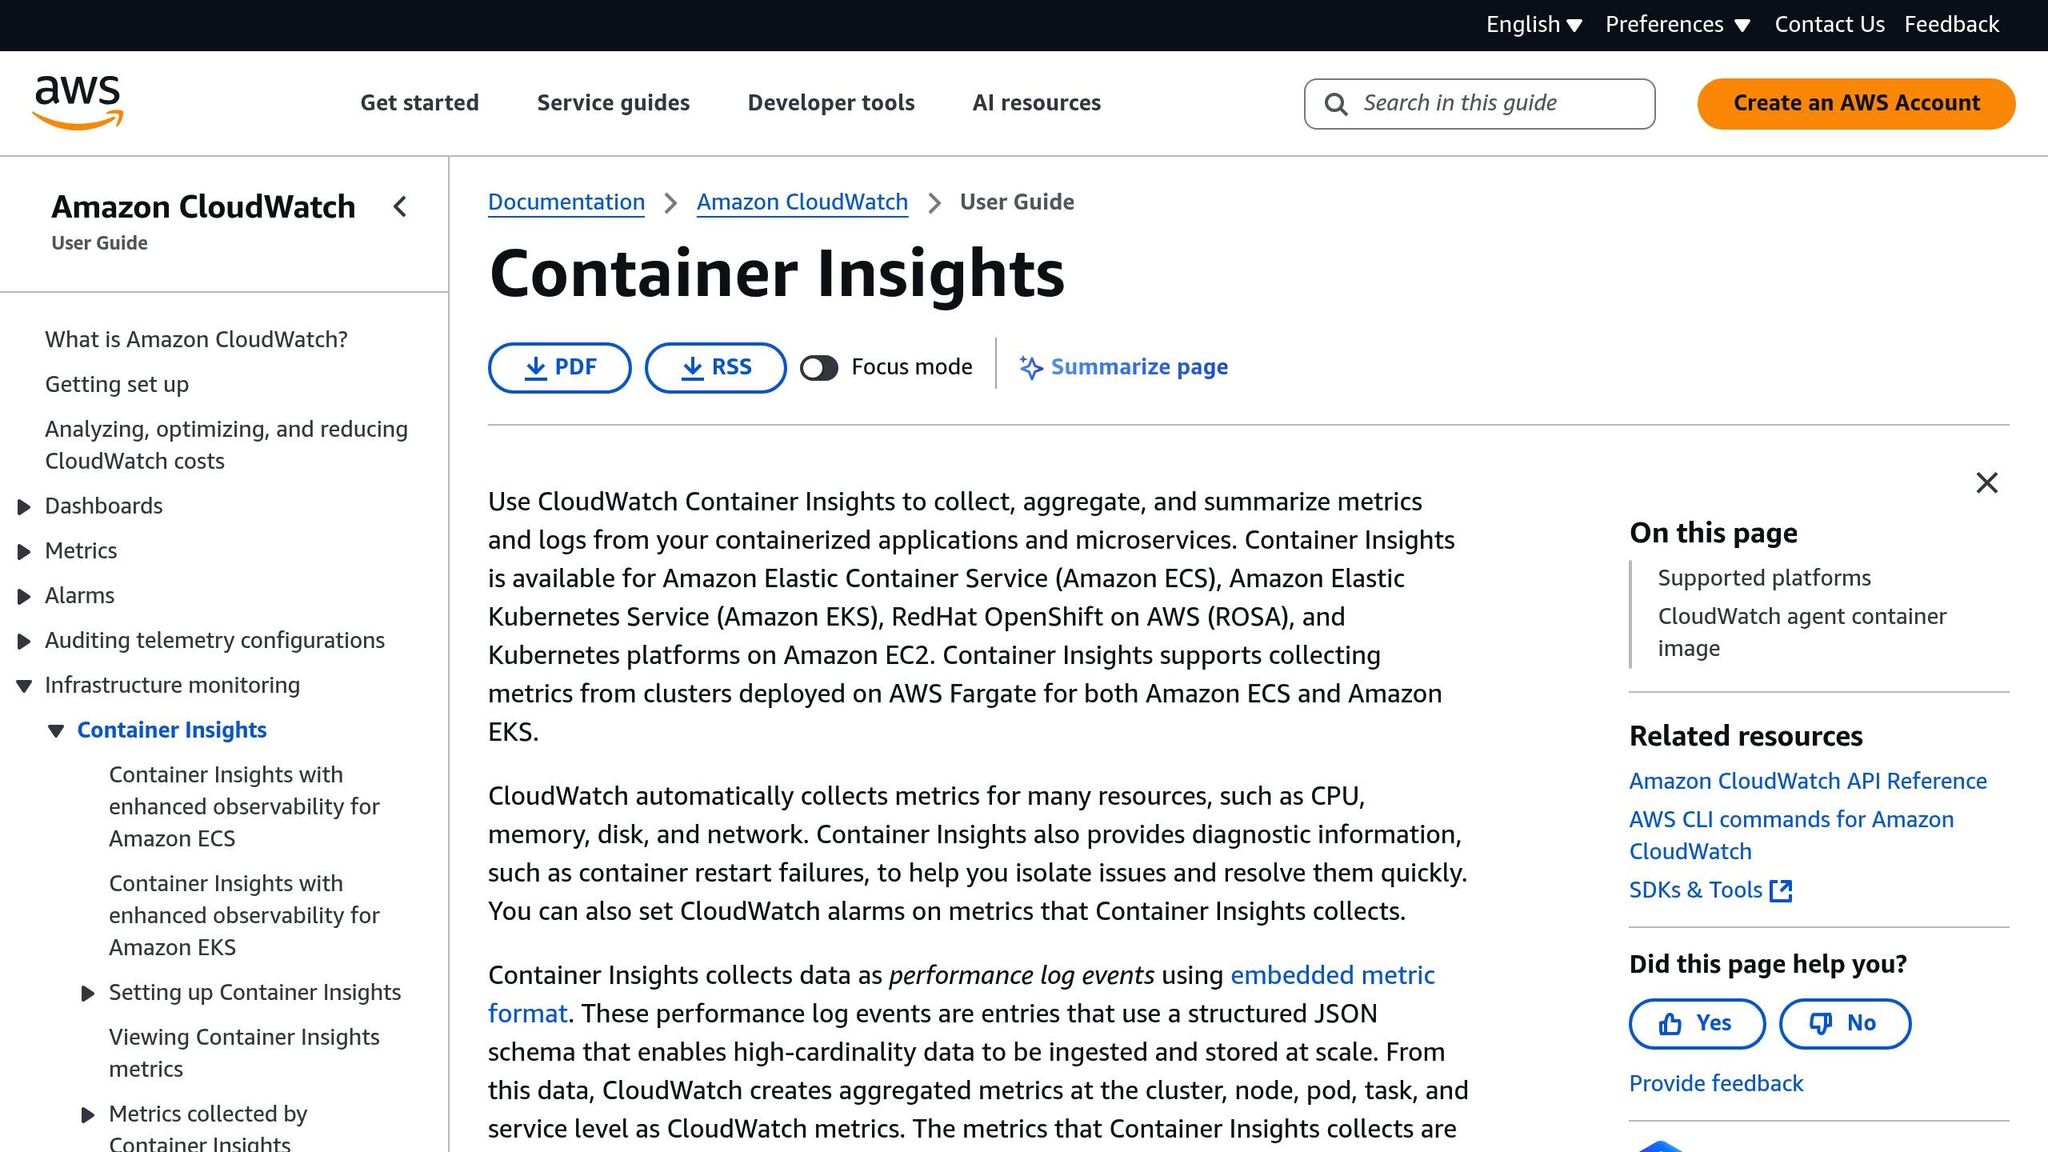
Container Insights provides an in-depth look at your Fargate workloads. To enable it, go to the Amazon ECS console, pick your cluster, and head over to the Configuration tab. Under the Monitoring section, toggle the Container Insights setting to "Enabled", then save your changes. This setting applies to all services and tasks within that cluster. The activation process usually takes 2–3 minutes, and you’ll see a confirmation once it’s complete.
When enabled, new deployments will automatically adopt the monitoring setup of the cluster. The service also creates a CloudWatch Log Group named /aws/ecs/containerinsights/[cluster-name]/performance, where enhanced metrics are stored.
You can also enable Container Insights using the AWS CLI with this command:
aws ecs put-account-setting --name "containerInsights" --value "enabled"
Once enabled, you can fine-tune metric collection to better fit your application’s monitoring needs.
Customizing Metric Collection
Fine-tuning metrics can improve your monitoring precision. For instance, you can publish custom or high-resolution metrics using the CloudWatch SDK. To do this, use the PutMetricData API with a StorageResolution of 1 for high-frequency (1-second) data. Adding custom dimensions like Environment=production or Application=web-api can help organize your metrics more effectively. Keep in mind, though, that high-resolution metrics might increase costs.
Custom dimensions can be added through task definition environment variables or by configuring your application’s CloudWatch client.
Another way to customize metrics is through log-based tracking. By creating metric filters from your application logs, you can monitor specific events - like user signups, payment transactions, or error occurrences. These custom metrics will show up alongside standard Fargate metrics in your CloudWatch dashboards, giving you a more complete view of your application’s performance.
Key Metrics for Monitoring Fargate with CloudWatch
CloudWatch automatically tracks several metrics from your Fargate tasks, giving you insights into the performance and resource usage of your containerized applications. These metrics are grouped into different namespaces, each offering unique levels of detail. Let’s break down the key metrics and their role in effective resource monitoring.
Core Fargate Metrics
When monitoring Fargate tasks, some of the most important metrics to watch include CPU utilization, memory usage, EBS filesystem usage, and the number of running tasks. CloudWatch gathers CPU and memory metrics automatically for any Amazon ECS service running on Fargate. These metrics are crucial for evaluating whether your tasks are using resources efficiently.
- CPU utilization: This metric shows what percentage of the allocated CPU is being used by your tasks. If CPU usage is consistently low (e.g., below 20%), it may indicate over-provisioning. On the flip side, high CPU usage (above 90%) could lead to performance issues. Setting alerts for usage spikes above 90% can help you address potential slowdowns before they affect users.
- Memory usage: This measures how much of the allocated memory your tasks are consuming. Keeping memory usage below 80% is ideal to avoid out-of-memory errors that could terminate your tasks. By keeping an eye on this metric, you can adjust task definitions and avoid over-allocating resources.
- EBS filesystem usage: For applications that store temporary data, logs, or other files on the container’s filesystem, monitoring EBS usage is critical. CloudWatch provides these metrics automatically for Fargate tasks.
- Running tasks count: AWS imposes a regional limit of 100 Fargate tasks. Monitoring the number of running tasks ensures you stay within this limit and helps you identify problems that might prevent tasks from starting properly. Comparing the desired task count against the actual running tasks can quickly highlight any discrepancies.
Metric Namespaces and Data Interpretation
CloudWatch organizes Fargate metrics into specific namespaces, making it easier to focus on the data you need.
- AWS/ECS namespace: This namespace offers free metrics for clusters and services, such as CPU and memory reservation, utilization, and EBS filesystem usage across clusters and services. It’s ideal for high-level monitoring and keeping costs in check.
- ECS/ContainerInsights namespace: For more detailed monitoring, this namespace provides per-task metrics, including CPU, memory, and EBS filesystem usage. While it gives a deeper look into individual tasks, it does come with additional costs.
- AWS/Usage namespace: This namespace tracks usage metrics like ResourceCount for vCPU, which is helpful for capacity planning and ensuring you don’t exceed service limits.
For EKS on Fargate, Kubernetes tools like the Metrics Server and kube-state-metrics provide pod-level metrics and state information.
Each metric is defined by its name, namespace, and dimensions, allowing you to filter and aggregate data by cluster, service, or task. This makes it easier to create dashboards and set up targeted alerts.
When analyzing these metrics, keep in mind that Fargate metrics are reported as percentages of the resources allocated to your tasks, not the underlying hardware. For instance, if a task shows 50% CPU utilization, it means it’s using half of its allocated CPU, making resource planning more predictable.
Visualizing and Analyzing Fargate Metrics in CloudWatch
Once you've set up Fargate metric collection, the next step is to make the data actionable. This is where CloudWatch dashboards and alarms come into play. Dashboards help you visualize trends and monitor your resources, while alarms ensure you're alerted to potential issues before they impact your users.
Creating Custom Dashboards
CloudWatch dashboards provide a central hub for monitoring Fargate metrics, even across multiple AWS accounts and regions. You can create them directly in the CloudWatch console or programmatically using the AWS CLI or the PutDashboard API.
Here’s how to create a dashboard through the CloudWatch console:
- Open the CloudWatch console at https://console.aws.amazon.com/cloudwatch/ and select Dashboards from the navigation pane.
- Click Create dashboard, give it a name, and start adding widgets.
- Choose from various widget types, such as line graphs, stacked area graphs, numeric displays, or text blocks.
When adding metrics, you'll find Fargate data organized in specific namespaces. For instance:
- The
AWS/Usagenamespace includes metrics likeResourceCountfor tracking vCPU usage. - The
ECS/ContainerInsights/Prometheusnamespace is ideal for custom application metrics.
If you manage multiple AWS accounts, CloudWatch's cross-account observability feature lets you view and graph metrics from all your accounts on one dashboard. For automation, the PutDashboard API allows you to define dashboards using JSON, making it easier to standardize and replicate setups.
While dashboards are excellent for visualizing data, alarms are critical for proactive monitoring.
Setting Up CloudWatch Alarms
Dashboards give you a clear picture of your metrics, but alarms ensure you're notified when something goes wrong - whether you're actively monitoring or not.
Start by identifying key metrics for your Fargate workloads, such as CPU utilization, memory usage, or service quota thresholds. For example, metrics like ResourceCount for vCPU usage are published in the AWS/Usage namespace, with dimensions such as Service: Fargate, Type: Resource, and Class: Standard/OnDemand or Standard/Spot.
Follow these steps to set up an alarm:
- Open the CloudWatch console, go to Alarms > All alarms, and click Create alarm.
- Choose the metric you want to monitor from the relevant namespace.
- Define a threshold, selecting a condition (e.g., greater than or less than) and a value. For instance, you might set an alarm to trigger when vCPU usage approaches your service quota. Use the datapoints to alarm feature to avoid false alerts from brief spikes.
- Decide how to handle missing data. For metrics that report only during errors, treat missing data as "not breaching." For continuous metrics like CPU usage, treating missing data as "breaching" can help catch potential monitoring gaps.
- Configure notifications. CloudWatch alarms have three states -
OK,ALARM, andINSUFFICIENT_DATA. You can set up Amazon SNS notifications to alert you to state changes or trigger automated responses like Auto Scaling actions, Lambda functions, or Systems Manager tasks. - Review your settings and create the alarm.
sbb-itb-6210c22
Using CloudWatch Metrics for Autoscaling Fargate Tasks
CloudWatch metrics play a key role in enabling autoscaling for Fargate workloads, automatically adjusting the number of tasks based on real-time performance data. By setting up detailed monitoring, you can ensure your Fargate tasks consistently meet demand without over-provisioning. This functionality builds on the earlier configuration of CloudWatch dashboards and alarms.
Fargate Autoscaling Overview
Fargate autoscaling works by using CloudWatch alarms to trigger scaling actions whenever specific thresholds are reached. This allows your application to dynamically adjust to changes in demand, ensuring it runs efficiently.
Configuring Autoscaling with CloudWatch Metrics
To set up autoscaling effectively, choose a metric that best reflects your workload's behavior. For CPU-bound applications, CPU utilization is often the most relevant. The metric ECSServiceAverageCPUUtilization, which corresponds to CPUUtilization in the AWS/ECS namespace, is a strong choice for such scenarios. By tailoring your scaling policies to align with your application's CPU usage, you can strike the right balance between maintaining performance and controlling costs.
Best Practices for Collecting and Using Fargate Metrics
When using AWS Fargate with CloudWatch, it's essential to strike a balance between cost management and gathering the insights you need. A great starting point is to make the most of the free metrics that Fargate already provides.
Optimizing Metric Collection
To get the most out of your monitoring efforts, begin with Fargate's free CPU metric. This built-in metric offers a dependable starting point for assessing performance without adding extra costs. If you find that you need more detailed insights, you can expand your setup with custom metrics - but keep an eye on the costs as you do so.
Limitations and Considerations
Before diving into additional metrics, take a moment to evaluate whether the extra data will provide actionable value. A targeted approach ensures that any enhancements to your monitoring setup are worth the investment. This way, you can avoid unnecessary spending while still maintaining the visibility you need to keep operations running smoothly.
Conclusion
Setting up CloudWatch to monitor AWS Fargate involves a series of steps that work together to give you a clear view of your containerized applications. While Fargate provides basic CPU and memory metrics out of the box, enabling Container Insights unlocks more detailed, per-task data for deeper analysis.
To ensure accurate monitoring, it's crucial to select the right namespaces and understand how metric retention works. CloudWatch organizes Fargate metrics under the AWS/ECS and ECS/ContainerInsights namespaces, with data retained for up to 15 months at different levels of granularity. Knowing how this structure works allows you to plan your monitoring strategy and manage costs more effectively.
Once your metrics are organized, the focus shifts to turning this data into actionable insights. Tools like custom dashboards, alarms, and Metric Math help you transform raw numbers into meaningful information that can drive decisions.
Your monitoring strategy should reflect your operational goals and budget. Start with Fargate's default metrics and expand gradually, prioritizing metrics that add the most value to your operations. This careful approach ensures you maintain the visibility needed for smooth container operations without overspending on monitoring.
FAQs
What IAM permissions do I need to monitor AWS Fargate tasks with CloudWatch?
To keep an eye on your Fargate tasks using CloudWatch, your IAM role needs specific permissions. These include logs:CreateLogStream, logs:PutLogEvents, cloudwatch:PutMetricData, and ecs:DescribeTasks. You can either attach the CloudWatchFullAccess policy or set up a custom policy that covers these permissions.
Don't forget to check that the ecsTaskExecutionRole is properly configured. This ensures your Fargate tasks can send their logs and metrics to CloudWatch without any hiccups.
What are the advantages of using Container Insights with AWS Fargate for monitoring?
Enabling Container Insights for AWS Fargate gives you a clearer picture of your containerized applications by offering detailed metrics, logs, and resource usage data. It helps track key performance indicators like CPU and memory usage, network traffic, and storage consumption, making it easier to keep tabs on your application's health.
By centralizing this critical data within Amazon CloudWatch, troubleshooting becomes more straightforward. You can quickly identify and address issues, saving time and effort. These insights also allow you to fine-tune resource allocation, improving the reliability and efficiency of your containerized workloads.
How can I use CloudWatch alarms and dashboards to monitor and optimize AWS Fargate performance?
To keep track of and improve the performance of AWS Fargate, leverage CloudWatch metrics to monitor CPU and memory usage. By setting up custom dashboards, you can view these metrics in real-time, making it easier to pinpoint performance issues or identify underutilized resources.
You can also configure CloudWatch alarms for key metrics like high CPU or memory usage. These alarms can send alerts or even trigger automated responses, helping you address potential problems before they affect your application. Regularly review and fine-tune alarm thresholds to align with workload patterns, ensuring efficient resource use and keeping costs under control.