Effective monitoring is crucial for maintaining the health and efficiency of your AWS cloud infrastructure and applications. This guide covers key metrics to track, essential AWS monitoring tools, best practices for setting up monitoring, and how to leverage monitoring with code for consistency and scalability.
Related video from YouTube
Key Metrics to Monitor
| Infrastructure | Application | Operational | Security | Cost |
|---|---|---|---|---|
| CPU Utilization | Response Times | Deployment Frequency | Login Attempts | Resource Utilization |
| Memory Usage | Error Rates | Lead Time | Network Traffic Patterns | Billing and Cost Estimates |
| Disk I/O | Request/Response Counts | Mean Time to Recover (MTTR) | Vulnerability Scans | Reserved Instance Usage |
| Network Traffic | Application Availability | Change Failure Rate | Incident Response Times | Storage and Data Transfer Costs |
| Instance Count | User Engagement | - | Compliance Adherence | Cost Allocation and Tagging |
Essential AWS Monitoring Tools

| Tool | Description |
|---|---|
| Amazon CloudWatch | Collect and analyze metrics and logs from AWS resources |
| AWS CloudTrail | Record and log AWS API calls for monitoring and auditing |
| AWS X-Ray | Trace requests and gain visibility into distributed applications |
| AWS Config | Maintain resource inventory, configuration history, and rules |
| AWS Trusted Advisor | Receive recommendations to optimize performance, security, and cost |
Best Practices
- Automate monitoring solutions to scale with your infrastructure
- Configure alerts to notify teams of issues and enable swift response
- Establish clear incident response protocols and provide team training
- Encourage collaboration and shared monitoring responsibilities
- Continuously review and optimize your monitoring strategy
Monitoring with Code
Monitoring with Code (MwC) involves managing monitoring configurations as code, enabling consistency, scalability, and version control. Key parts include:
- Configuration files defining monitoring settings and alerts
- Version control for tracking changes and collaboration
- Automation tools for deploying monitoring configurations
Monitoring Dashboards
Customize monitoring dashboards for clear visibility tailored to different teams' needs:
- Operations: System health, performance, and availability metrics
- Development: Application-level metrics like error rates and response times
- Security: Security-related metrics and compliance violations
- Executives: High-level summaries of KPIs and system health
Monitoring in AWS DevOps
Monitoring is crucial for ensuring the reliability, availability, and performance of applications and infrastructure in AWS DevOps. It involves tracking key metrics and logs to:
- Identify issues
- Optimize resource usage
- Improve customer experience
There are several types of monitoring in AWS:
Performance Monitoring
This tracks the speed, throughput, and responsiveness of applications and services. Key metrics include:
- CPU utilization
- Memory usage
- Disk I/O
- Network traffic
By monitoring performance, teams can identify bottlenecks, optimize resource allocation, and ensure smooth operation.
Security Monitoring
This detects and responds to security threats in real-time. Key metrics include:
- Login attempts
- Access requests
- Network traffic patterns
By monitoring security, teams can identify vulnerabilities, detect anomalies, and respond quickly to incidents.
Cost Monitoring
This optimizes cloud resource usage and controls costs. Key metrics include:
- Instance usage
- Storage consumption
- Data transfer
By monitoring costs, teams can identify inefficiencies, optimize resource allocation, and reduce waste.
Operational Monitoring
This tracks the availability, reliability, and maintainability of applications and services. Key metrics include:
- Uptime
- Downtime
- Mean time to recover (MTTR)
By monitoring operations, teams can identify areas for improvement, optimize workflows, and ensure high-quality service delivery.
In AWS, monitoring is a shared responsibility between AWS and the customer. AWS provides tools like Amazon CloudWatch, AWS CloudTrail, and AWS X-Ray. Customers are responsible for configuring and using these tools to monitor their applications and infrastructure effectively.
Monitoring in AWS DevOps helps teams ensure the reliability, availability, and performance of their applications and infrastructure, and deliver high-quality services to customers.
Key Metrics to Monitor
Monitoring key metrics is crucial for ensuring the performance, security, and cost-effectiveness of your AWS resources and services. Here are the essential metrics to track in AWS DevOps:
Infrastructure Metrics
These metrics help you identify bottlenecks and optimize resource allocation:
| Metric | Description |
|---|---|
| CPU Utilization | Tracks CPU usage of EC2 instances and other resources |
| Memory Usage | Monitors memory consumption |
| Disk I/O | Measures disk read/write operations |
| Network Traffic | Tracks incoming and outgoing network data |
| Instance Count and Type | Monitors the number and types of instances running |
| Storage Capacity and Usage | Tracks storage space utilization |
Application Metrics
These metrics help you optimize application performance and user experience:
| Metric | Description |
|---|---|
| Response Time and Latency | Measures application response times |
| Error Rates and Exceptions | Tracks application errors and exceptions |
| Request and Response Counts | Monitors incoming requests and outgoing responses |
| Application Availability and Uptime | Tracks application uptime and downtime |
| User Engagement and Satisfaction | Measures user interactions and satisfaction levels |
Operational Metrics
These metrics help you optimize workflows and ensure efficient service delivery:
| Metric | Description |
|---|---|
| Deployment Frequency and Speed | Tracks how often and how quickly deployments occur |
| Lead Time and Cycle Time | Measures the time it takes to go from code commit to production |
| Mean Time to Recover (MTTR) | Tracks the average time to recover from failures |
| Mean Time Between Failures (MTBF) | Measures the average time between system failures |
| Change Failure Rate and Success Rate | Monitors the success rate of changes and deployments |
Security Metrics
These metrics help you detect threats and respond to incidents:
| Metric | Description |
|---|---|
| Login Attempts and Access Requests | Tracks unauthorized access attempts |
| Network Traffic Patterns and Anomalies | Monitors unusual network activity |
| Vulnerability Scans and Patching Rates | Tracks vulnerabilities and patching efforts |
| Incident Response and Remediation Times | Measures the time to respond to and resolve incidents |
| Compliance and Regulatory Adherence | Monitors compliance with security standards and regulations |
Cost Metrics
These metrics help you optimize resource usage and control costs:
| Metric | Description |
|---|---|
| Resource Utilization and Allocation | Tracks resource usage and allocation |
| Billing and Cost Estimates | Monitors billing and cost estimates |
| Reserved Instance Usage and Optimization | Tracks usage and optimization of reserved instances |
| Storage and Data Transfer Costs | Monitors costs related to storage and data transfer |
| Cost Allocation and Tagging | Tracks cost allocation and tagging for better cost management |
sbb-itb-6210c22
Setting Baselines and Thresholds
Establishing baselines and thresholds is crucial for effective monitoring in AWS DevOps. Baselines represent normal system behavior, while thresholds indicate limits beyond which issues or anomalies are detected. Proper baselines and thresholds enable you to identify deviations, detect potential problems, and respond promptly.
To set effective baselines and thresholds, follow these steps:
Identify Key Metrics
Determine the critical metrics that align with your business goals and application requirements. These may include:
- CPU utilization
- Memory usage
- Response times
- Error rates
Focus on metrics that provide meaningful insights into system performance and user experience.
Analyze Historical Data
Examine past data to understand typical system behavior and patterns. This helps determine average and peak values for your key metrics, informing your baseline and threshold settings.
Consult Industry Standards
Refer to industry benchmarks and best practices to determine suitable baselines and thresholds for your application. For example, the AWS Well-Architected Framework provides guidelines for setting performance, security, and cost optimization metrics.
Monitor and Refine Continuously
Continuously monitor your system and adjust your baselines and thresholds as needed. This ensures your monitoring setup remains effective and responsive to changing system conditions.
| Step | Description |
|---|---|
| 1. Identify Key Metrics | Determine critical metrics aligned with business goals and application requirements. |
| 2. Analyze Historical Data | Examine past data to understand typical system behavior and patterns. |
| 3. Consult Industry Standards | Refer to industry benchmarks and best practices for suitable baselines and thresholds. |
| 4. Monitor and Refine Continuously | Continuously monitor and adjust baselines and thresholds as system conditions change. |
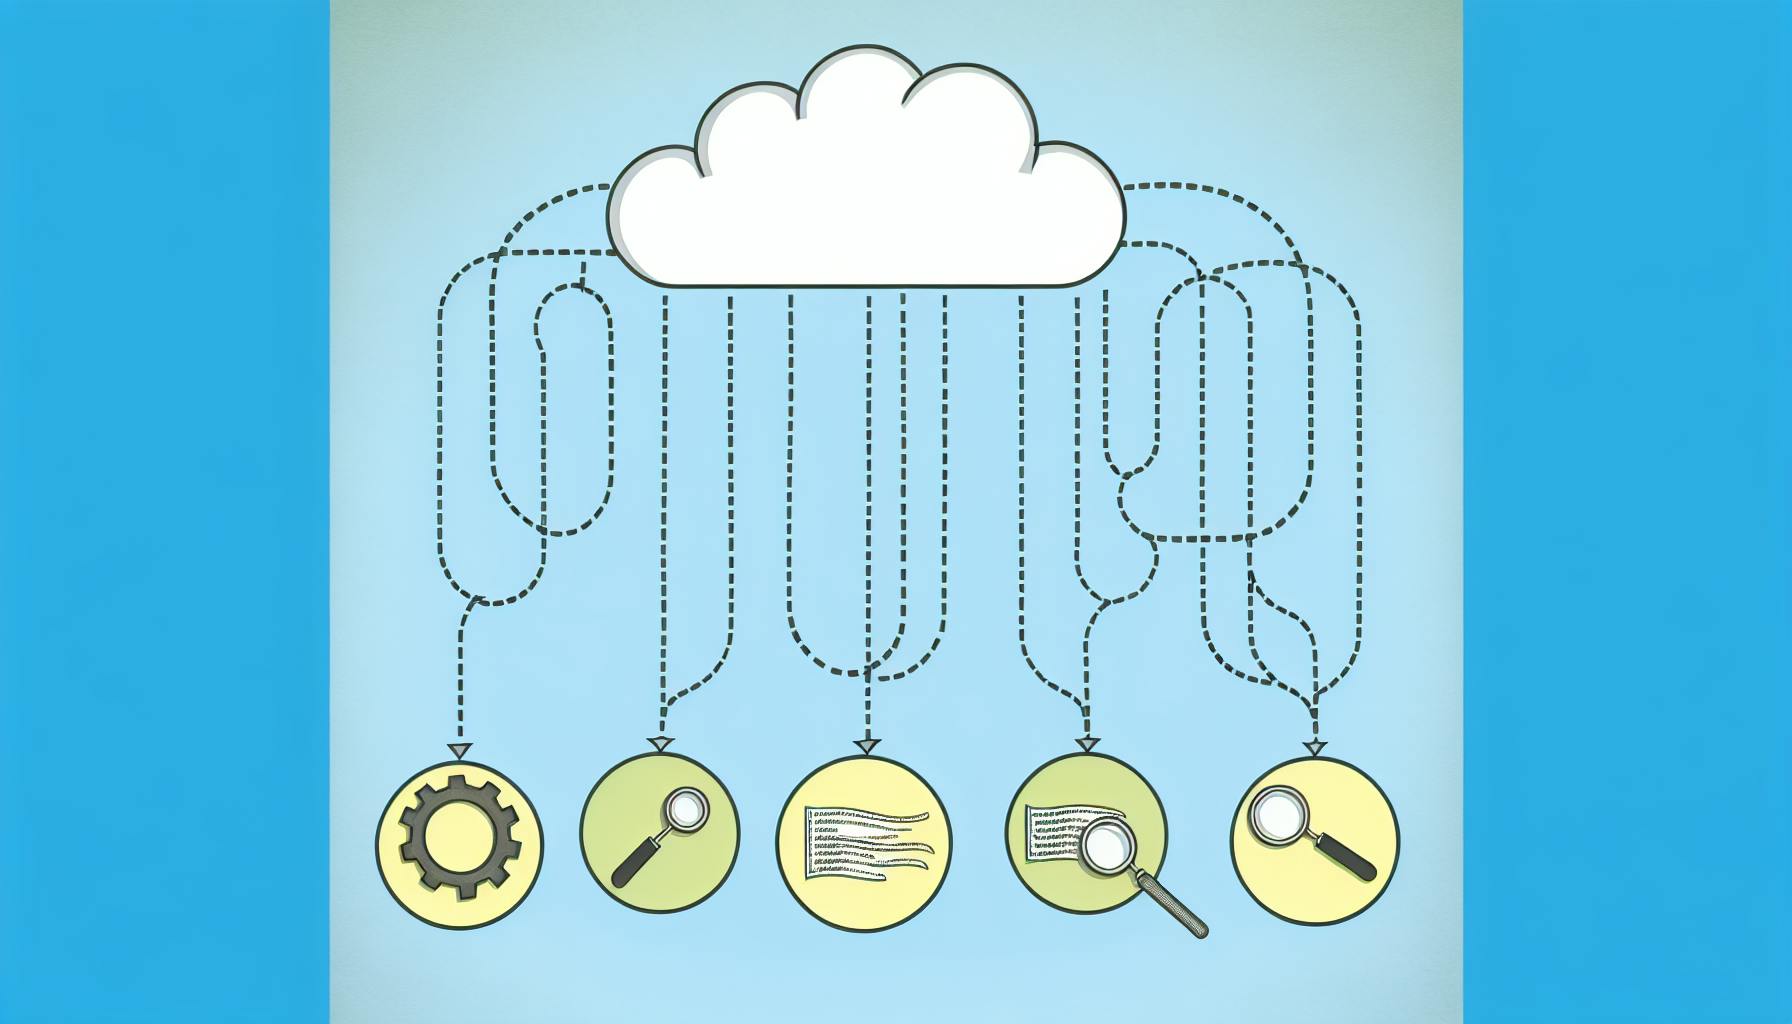
AWS Monitoring Tools
AWS provides several tools to help you monitor your AWS resources, applications, and services. These tools allow you to track performance, identify issues, and optimize your AWS environment.
Amazon CloudWatch

CloudWatch is a monitoring service that collects and analyzes metrics and logs from your AWS resources. Key features include:
- Metrics Collection: Gather detailed metrics from resources like EC2 instances, Lambda functions, and RDS databases.
- Custom Metrics: Create custom metrics to monitor specific aspects of your applications.
- Dashboards: Visualize metrics and logs in custom dashboards for at-a-glance monitoring.
- Alarms: Set up alarms to notify you when thresholds are breached.
AWS CloudTrail
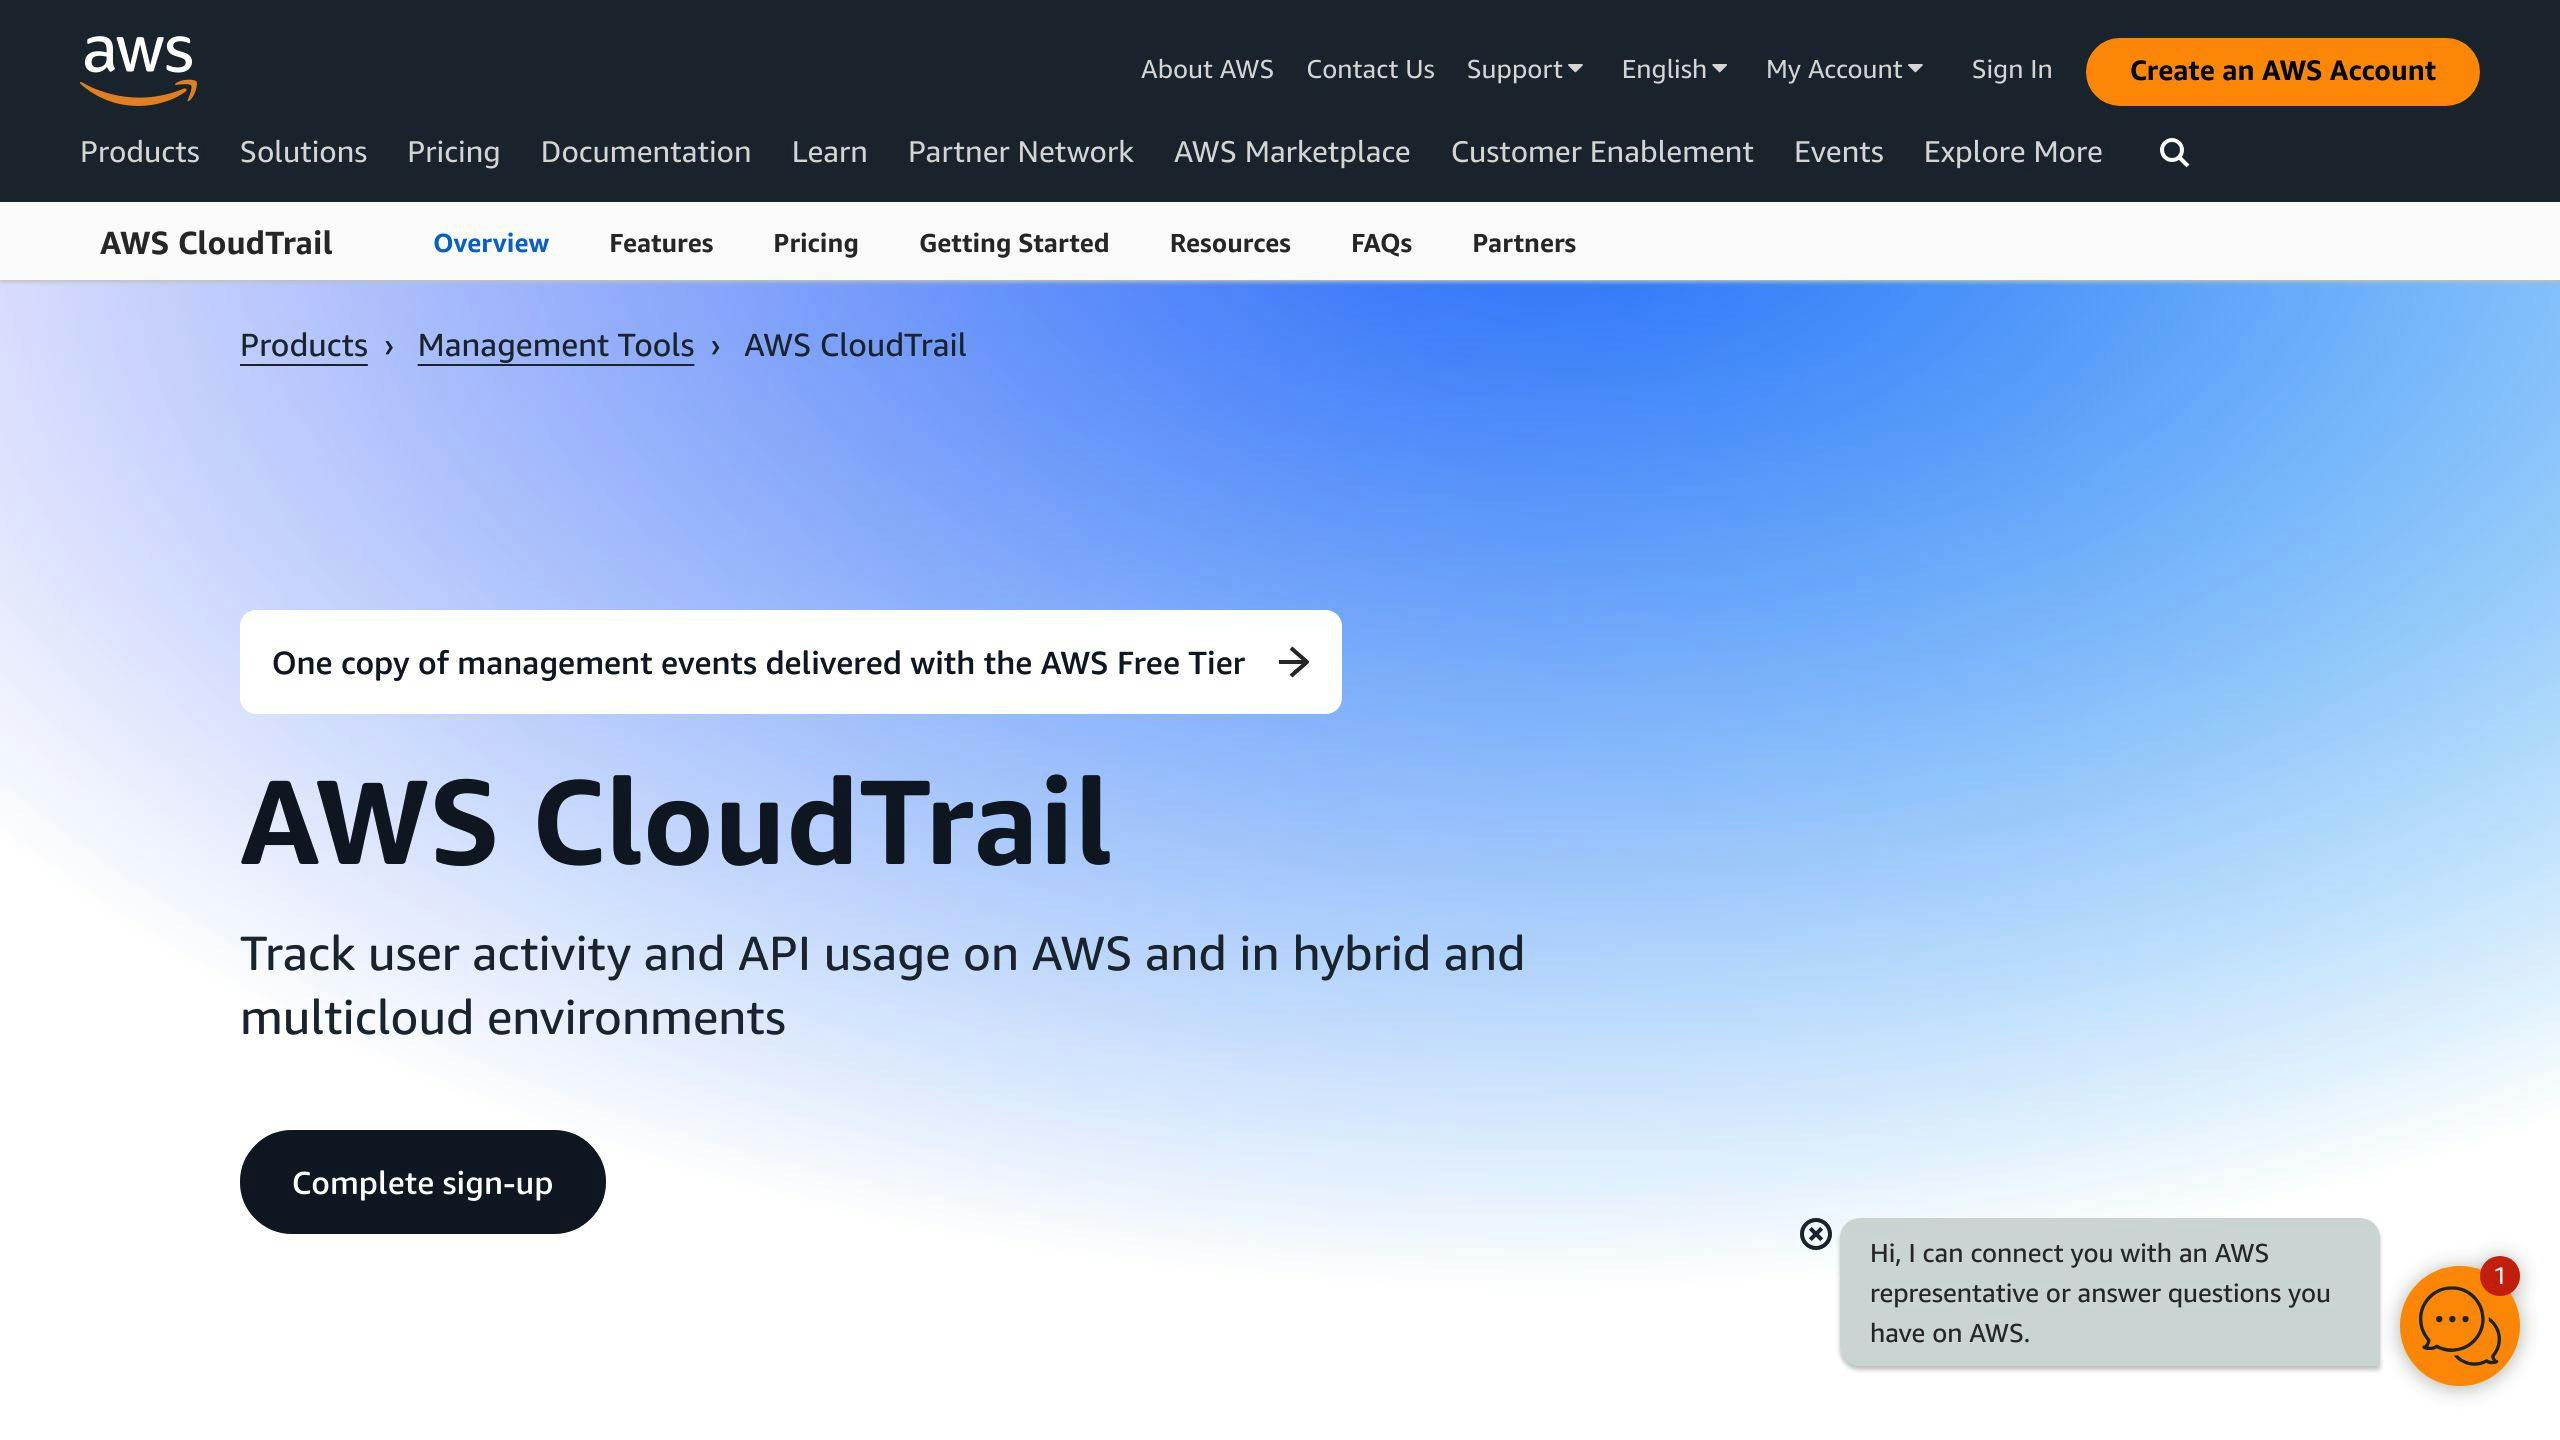
CloudTrail records and logs AWS API calls made on your account. Key features include:
- Event Logging: Logs API activity across all AWS services used in your account.
- Event History: Provides a searchable history of API calls.
- Integration: Integrates with other AWS services for analysis, monitoring, and alerting.
- Compliance and Security: Helps meet compliance requirements and enhances security by monitoring API activity.
AWS X-Ray

X-Ray provides visibility into the performance and behavior of your distributed applications. Key features include:
- Data Collection: Collects data about requests as they travel through your application and services.
- Detailed Tracing: Provides detailed tracing data about requests, including response times, latency, and errors.
- Use Case: Designed for performance optimization and troubleshooting in distributed applications.
AWS Config
Config provides resource inventory, configuration history, and configuration rules to evaluate your AWS resources. Key features include:
- Resource Inventory: Detailed inventory of your AWS resources and their configurations.
- Configuration History: Maintains a history of configuration changes to your resources.
- Configuration Rules: Define rules to evaluate the configuration of your resources.
AWS Trusted Advisor
Trusted Advisor provides recommendations to optimize your AWS environment for performance, security, and cost. Key features include:
- Cost Optimization: Recommendations to reduce your AWS costs.
- Security: Recommendations to improve the security of your resources.
- Performance: Recommendations to improve the performance of your resources.
AWS Service Catalog
Service Catalog allows you to create and manage catalogs of approved IT services for use on AWS. Key features include:
- Service Catalog: Centralized catalog of approved IT services for AWS.
- Portfolio Management: Manage portfolios of IT services.
- Launch Constraints: Ensure IT services are launched with the correct configuration and permissions.
These AWS monitoring tools help you track, analyze, and optimize your AWS resources, applications, and services.
Third-Party Monitoring Tools
AWS provides robust monitoring tools, but third-party solutions can offer additional features and capabilities. Here are some popular options:
Datadog
- Overview: Datadog monitors applications, infrastructure, and services, providing detailed metrics and logs analysis.
- Key Features:
- Real-time monitoring
- Custom dashboards
- Integration with AWS services like CloudWatch, CloudTrail, and X-Ray
| Pros | Cons |
|---|---|
| Comprehensive monitoring | Steep learning curve |
| Customizable dashboards | Can be expensive for large environments |
New Relic
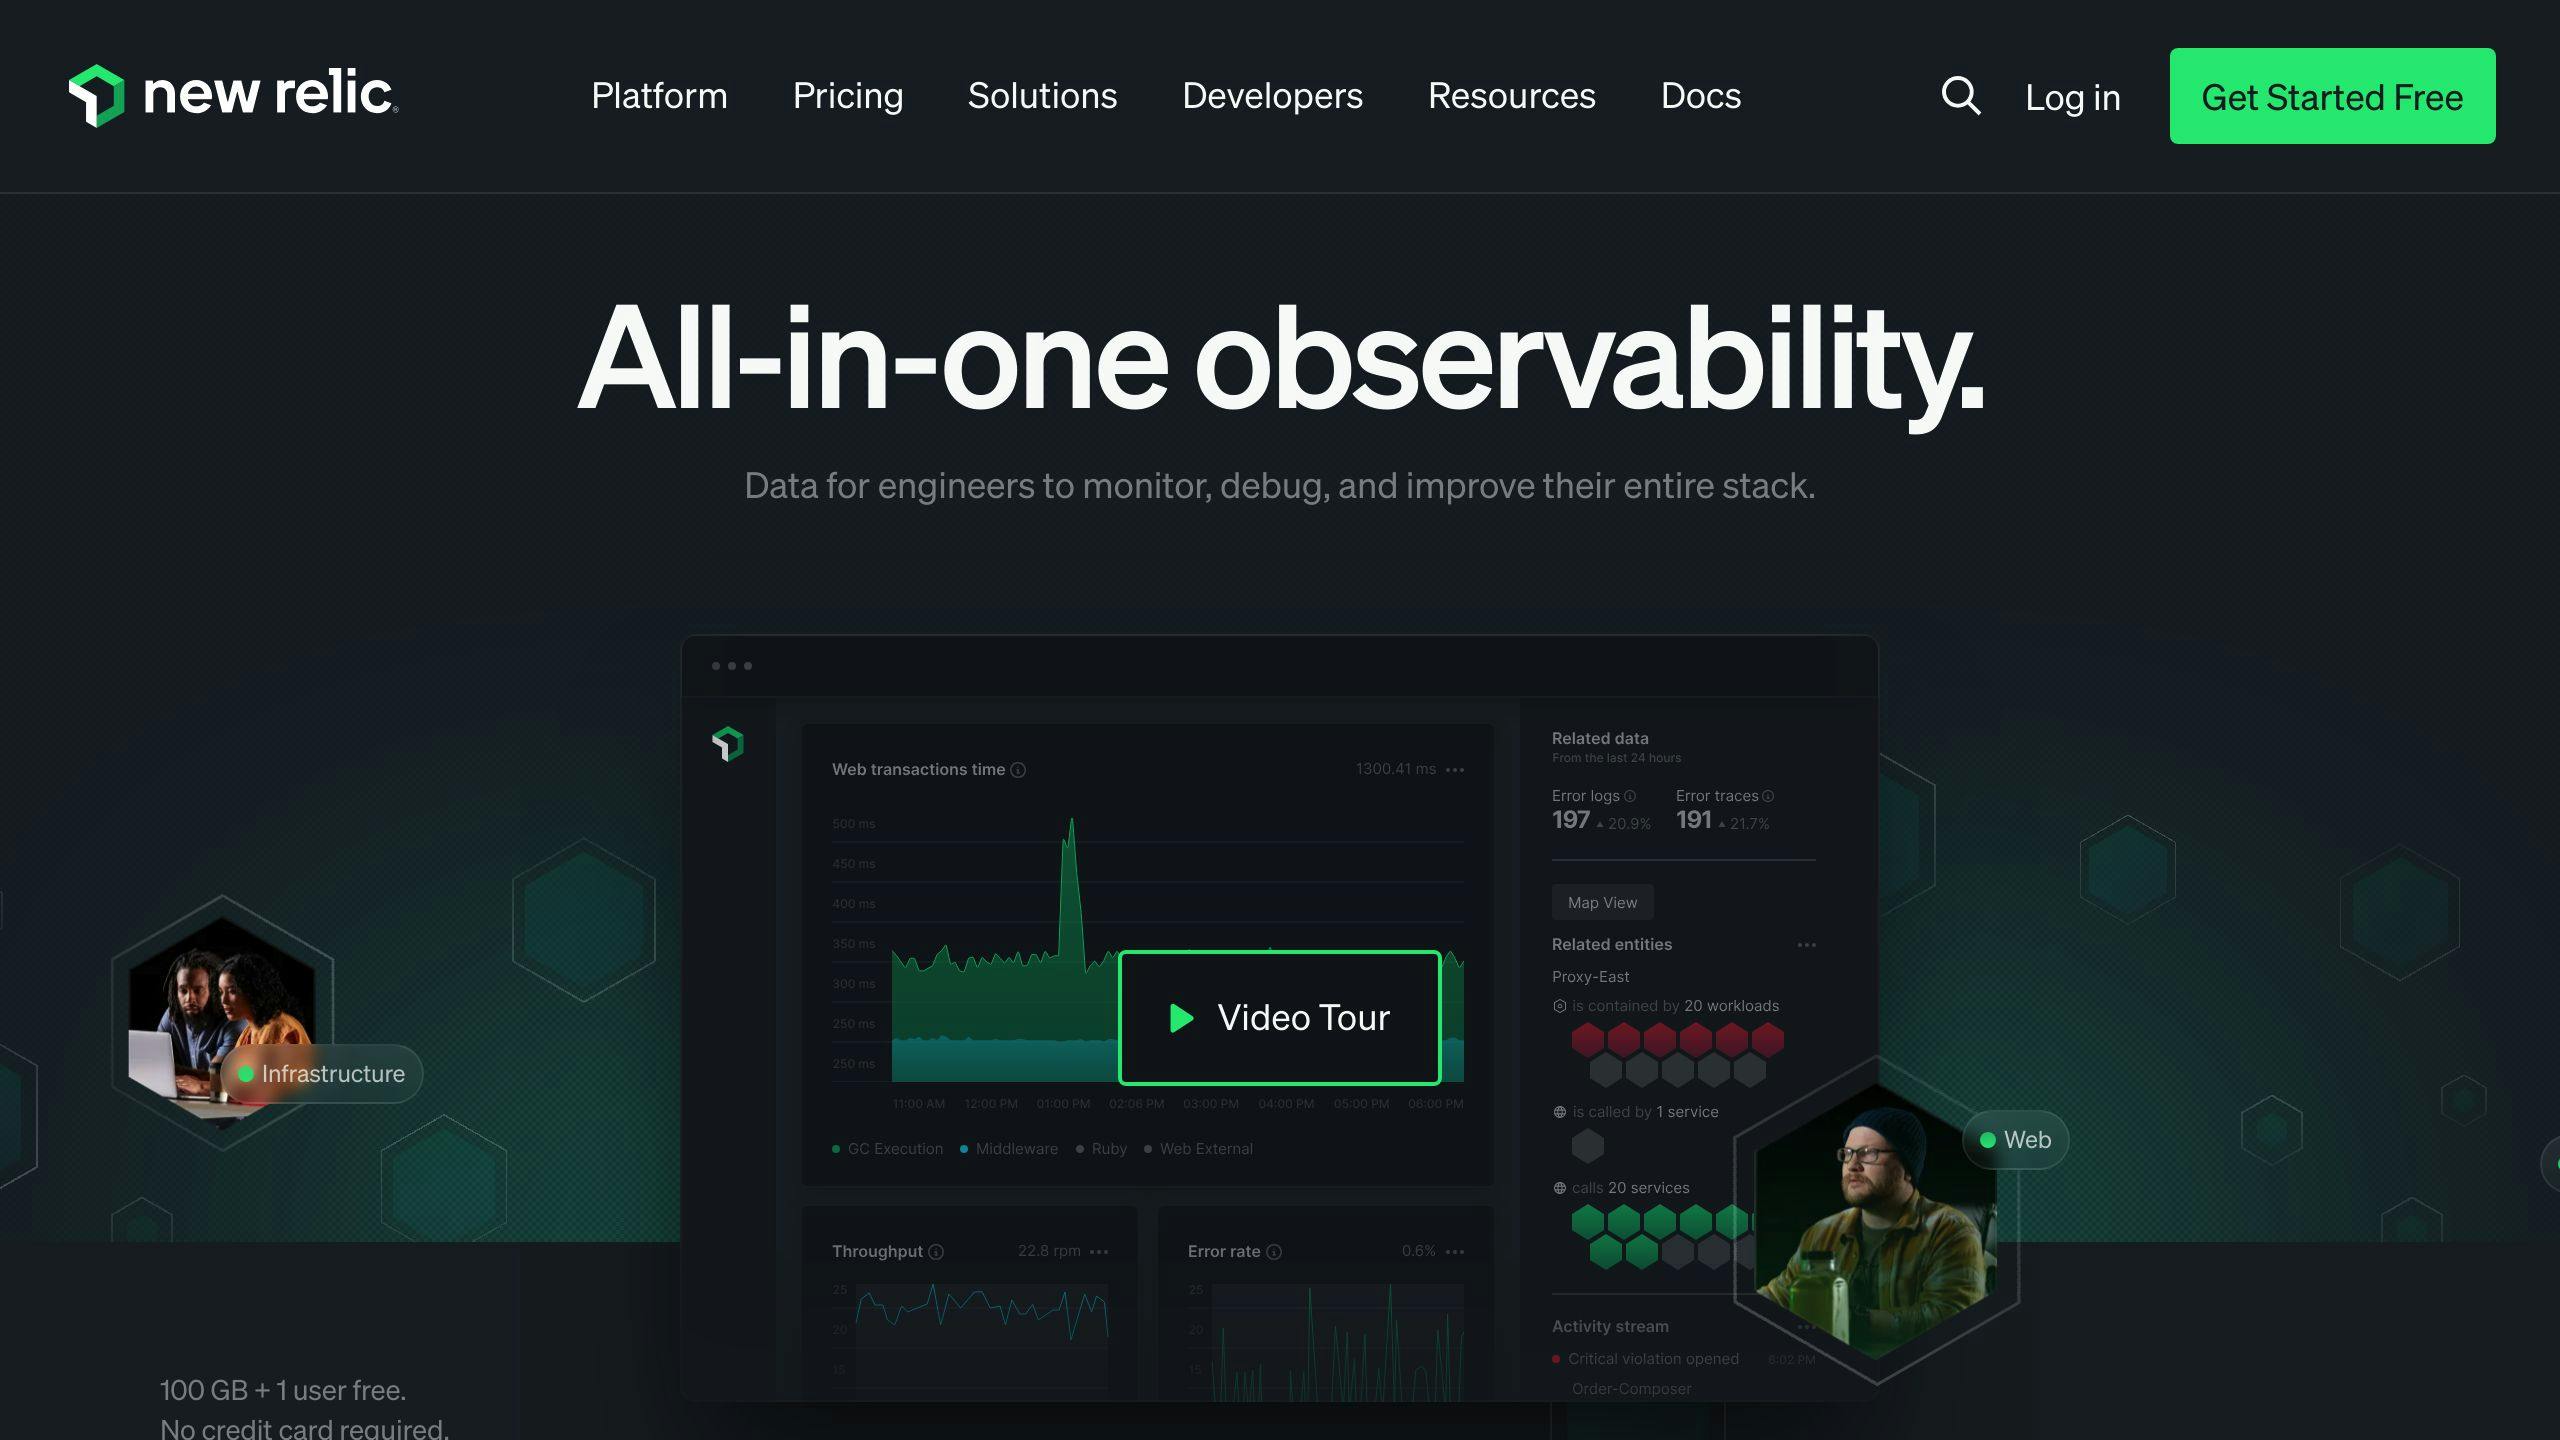
- Overview: New Relic focuses on application performance monitoring and analytics.
- Key Features:
- Deep application insights
- Real-time analytics
- Integration with AWS services like CloudWatch and X-Ray
| Pros | Cons |
|---|---|
| Detailed application performance insights | Limited infrastructure monitoring capabilities |
| Real-time analytics | Complex setup and configuration |
Dynatrace

- Overview: Dynatrace is an AI-powered monitoring tool for application performance and user experience.
- Key Features:
- AI-powered analytics
- Real-time monitoring
- Integration with AWS services like CloudWatch and X-Ray
| Pros | Cons |
|---|---|
| AI-powered analytics | Expensive for large environments |
| Real-time monitoring | Steep learning curve |
AppDynamics

- Overview: AppDynamics provides insights into application performance and user experience.
- Key Features:
- Comprehensive monitoring
- Real-time analytics
- Integration with AWS services like CloudWatch and X-Ray
| Pros | Cons |
|---|---|
| Real-time analytics | Limited infrastructure monitoring capabilities |
| Integration with AWS services | Complex setup and configuration |
Splunk

- Overview: Splunk specializes in log data and metrics analysis.
- Key Features:
- Detailed log analysis
- Real-time monitoring
- Integration with AWS services like CloudWatch and CloudTrail
| Pros | Cons |
|---|---|
| Comprehensive log analysis | Steep learning curve |
| Real-time monitoring | Can be expensive for large environments |
Prometheus
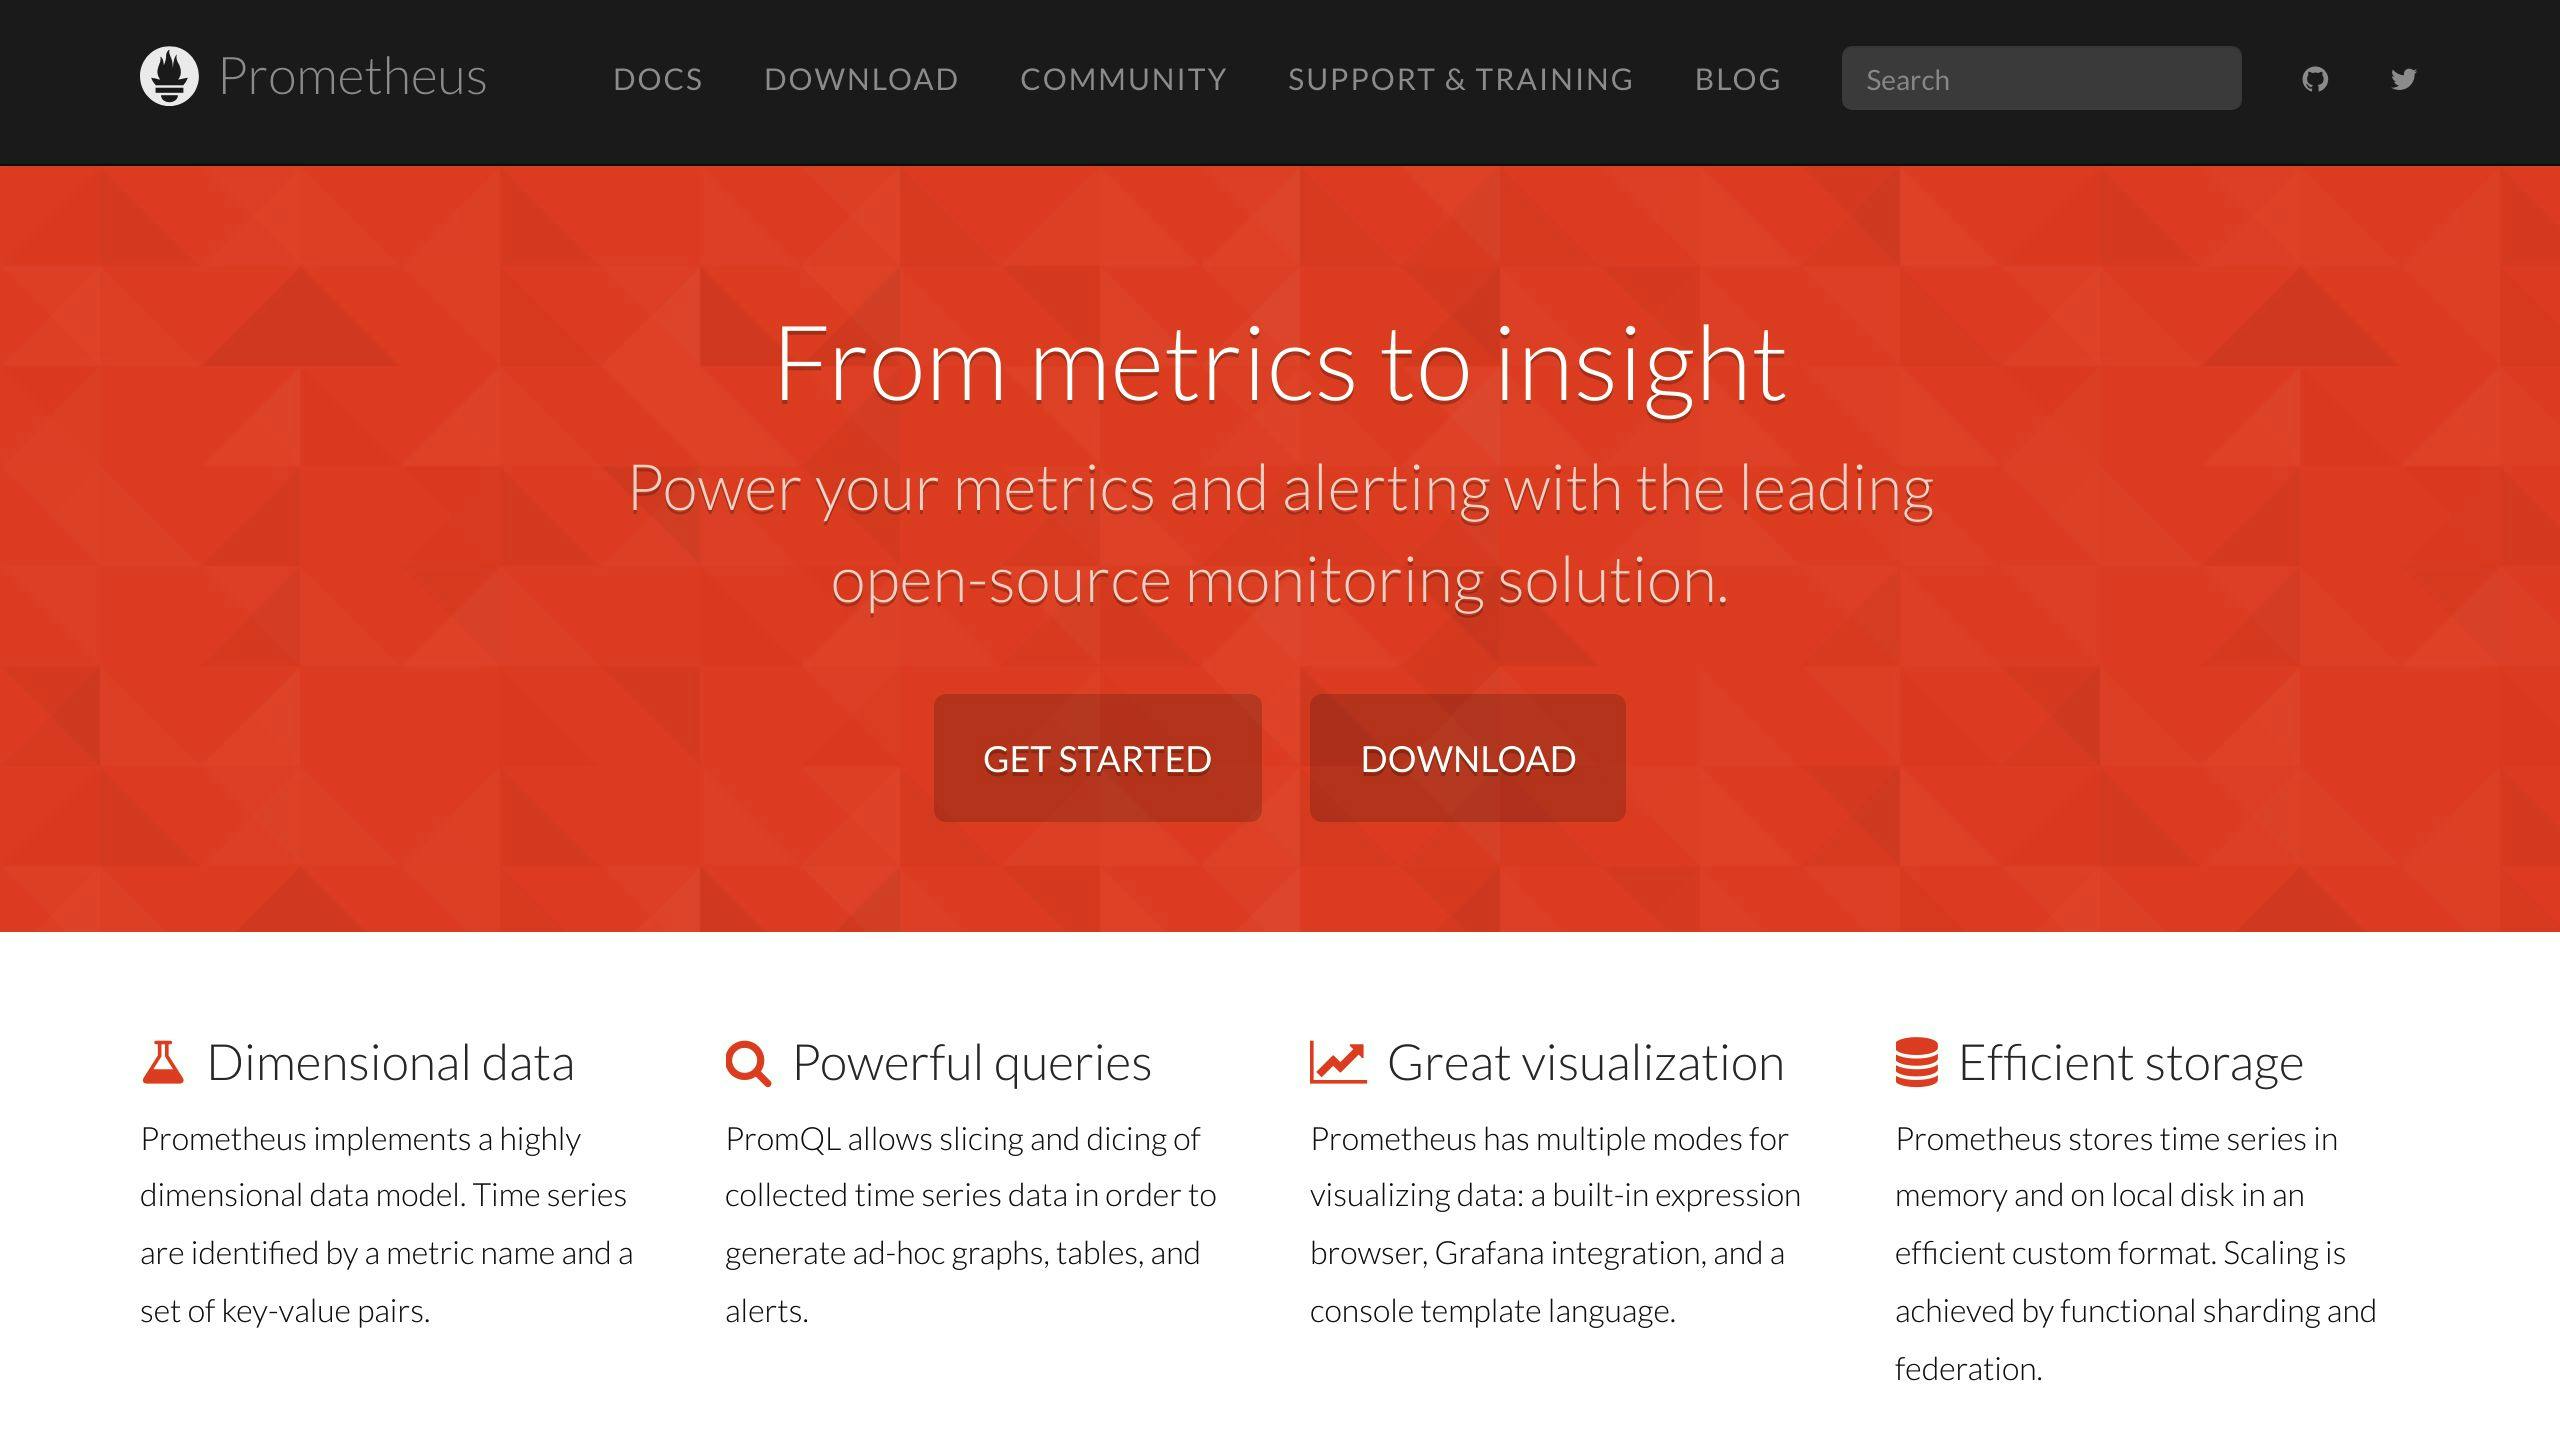
- Overview: Prometheus is an open-source monitoring tool for metrics and logs data.
- Key Features:
- Highly customizable
- Scalable for large environments
- Integration with AWS services like CloudWatch and X-Ray
| Pros | Cons |
|---|---|
| Customizable | Steep learning curve |
| Scalable | Limited support (open-source) |
Grafana
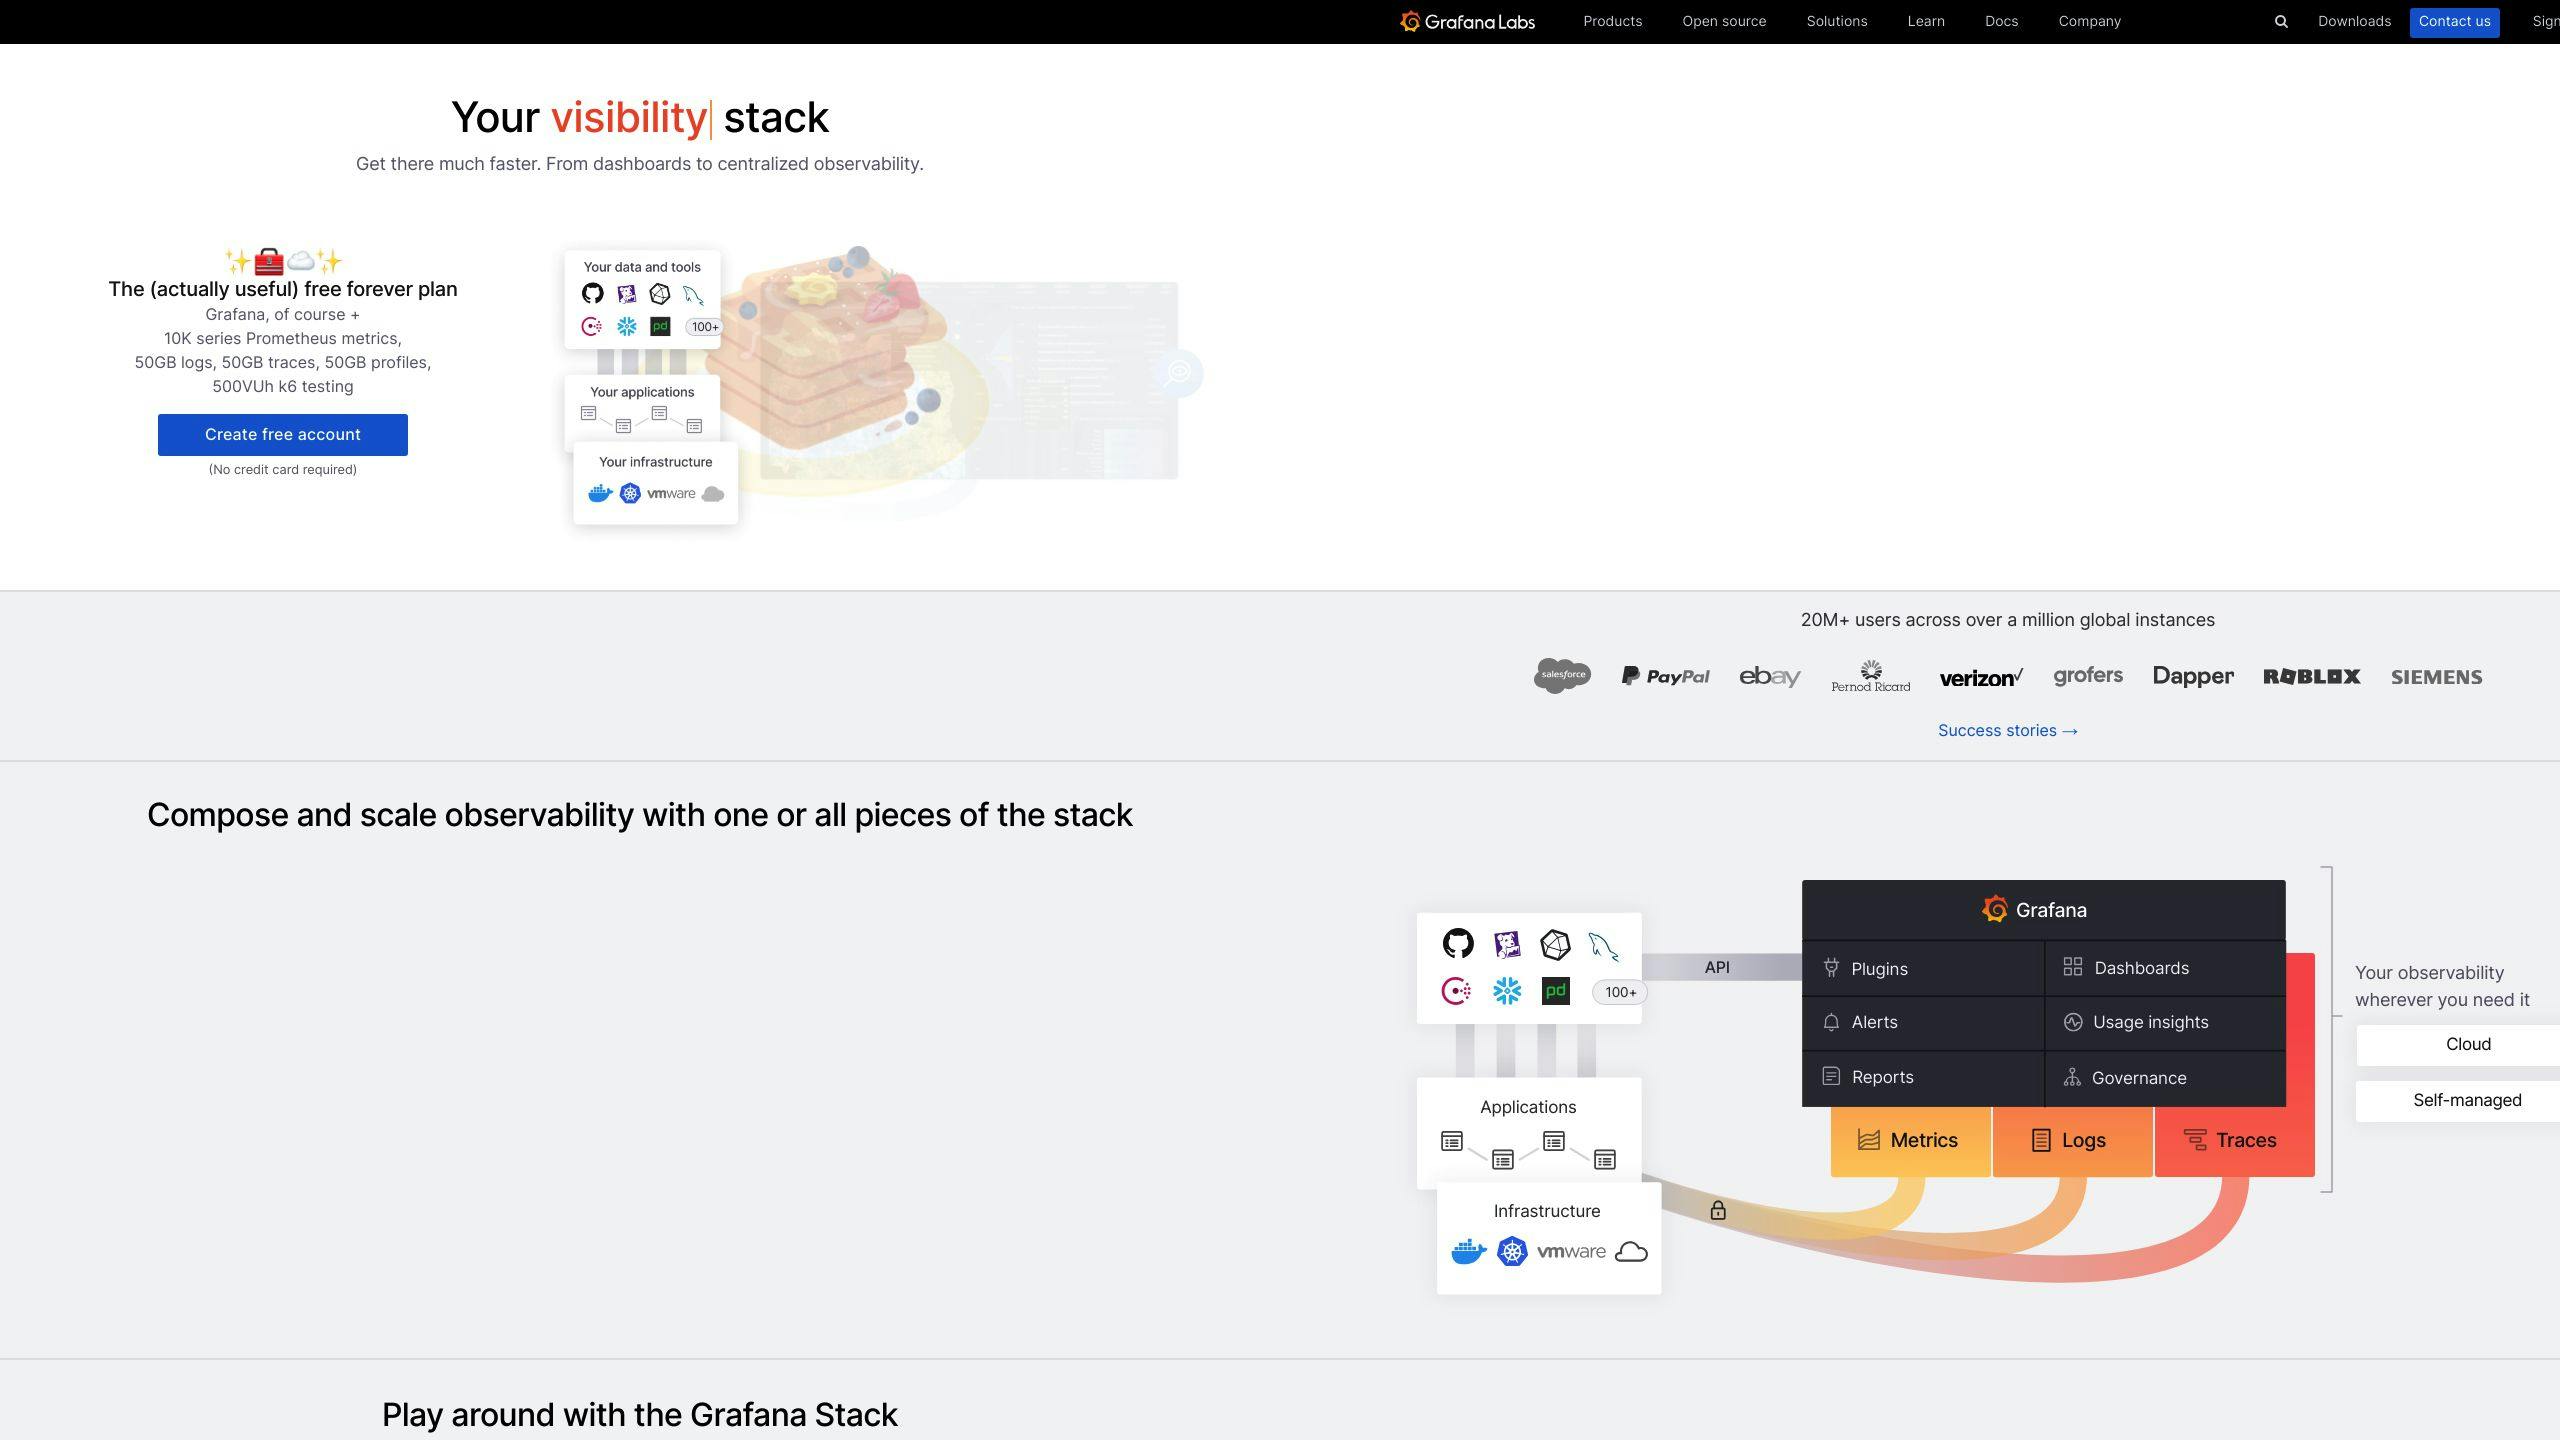
- Overview: Grafana is a visualization tool for metrics and logs data.
- Key Features:
- Custom dashboards
- Real-time monitoring
- Integration with AWS services like CloudWatch and X-Ray
| Pros | Cons |
|---|---|
| Custom dashboards | Limited analytics capabilities |
| Real-time monitoring | Dependent on data sources like Prometheus or Splunk |
These third-party tools offer additional monitoring capabilities beyond AWS's native services. Consider your specific needs, budget, and team's expertise when evaluating these options.
Combining Monitoring Tools for Better Visibility
Integrating monitoring tools gives you a clearer view of your AWS environment. By combining AWS tools with third-party solutions, you can gain deeper insights into your infrastructure, applications, and services. Here's why integration is important and how to do it effectively.
Benefits of Integration
Integrating monitoring tools offers these advantages:
- Complete visibility: Combining multiple tools provides a more detailed understanding of your entire AWS environment.
- Faster incident response: Integrated tools enable quicker detection, analysis, and resolution of issues, reducing downtime.
- Improved collaboration: Integrated tools allow teams to access the same data and insights, facilitating better collaboration.
Examples of AWS Tool Integrations
Here are some examples of integrating AWS tools with third-party solutions:
| Integration | Description |
|---|---|
| CloudWatch + Datadog | Combine CloudWatch metrics with Datadog for enhanced application monitoring and analytics. |
| CloudTrail + Splunk | Integrate CloudTrail logs with Splunk for detailed log analysis and security monitoring. |
| X-Ray + New Relic | Combine X-Ray tracing data with New Relic for comprehensive application performance monitoring. |
Best Practices for Integration
When integrating monitoring tools, follow these best practices:
1. Define clear goals: Identify the specific benefits you want to achieve, such as improved incident response or better collaboration.
2. Choose compatible tools: Select tools that work well together and with your AWS environment.
3. Use standard data formats: Use formats like JSON or CSV to facilitate data exchange between tools.
4. Consolidate data: Bring data from multiple tools into a single platform or dashboard for easier analysis and decision-making.
Setting Up Monitoring in AWS
Identify Monitoring Needs
First, determine what you need to monitor:
- Define your monitoring goals
- Identify critical systems and components
- Determine key metrics to track
- Establish a monitoring strategy
Choose and Configure Tools
Next, select and set up the right monitoring tools:
| Task | Details |
|---|---|
| Select AWS Tools | Choose tools like CloudWatch, CloudTrail, and X-Ray |
| Add Third-Party Tools | Pick tools that integrate with AWS services |
| Configure Tools | Set up tools to collect and analyze data |
Set Up Monitoring Processes
Establish processes for continuous monitoring and incident response:
- Define monitoring and incident response workflows
- Set up communication channels for collaboration
- Configure automated alerting and notifications
Automate Monitoring Tasks
Automate repetitive monitoring tasks and alerts:
- Use AWS services like Lambda and CloudWatch Events
- Integrate third-party automation tools
- Set up automated alerts and notifications
Continuously Optimize
Regularly review and improve your monitoring setup:
- Continuously monitor and analyze data
- Identify areas for improvement
- Optimize tools and workflows
Monitoring with Code
Monitoring with Code (MwC) is a method of managing and setting up monitoring through code. This practice helps ensure consistency, scalability, and version control for monitoring strategies. MwC is similar to Infrastructure as Code (IaC), where infrastructure is provisioned and managed using code. With MwC, monitoring rules, alerts, and dashboards are defined as code.
Key Parts of Monitoring with Code
MwC has three main parts:
- Configuration Files: These files define monitoring settings, thresholds, and alerts. They are usually written in a specific language or standard formats like YAML or JSON.
- Version Control: The configuration files are stored in version control systems, allowing tracking of changes, collaboration, and historical analysis.
- Automation Tools: Automation is central to MwC. Tools that support MwC automate the deployment and updating of monitoring configurations across various environments.
Advantages of Monitoring with Code
MwC offers several advantages:
- Consistency: MwC ensures monitoring practices are consistent across different environments and applications.
- Scalability: MwC makes it easier to scale monitoring solutions as infrastructure grows.
- Rapid Deployment and Recovery: Changes in monitoring configurations can be rolled out quickly and uniformly. Similarly, previous versions of configurations can be restored quickly in case of errors.
- Improved Collaboration and Visibility: MwC promotes collaboration among development, operations, and QA teams. Monitoring configurations stored as code make it easier for teams to understand and contribute to monitoring practices.
| Advantage | Description |
|---|---|
| Consistency | Monitoring practices are consistent across environments and applications. |
| Scalability | Monitoring solutions can be easily scaled as infrastructure grows. |
| Rapid Deployment and Recovery | Monitoring configurations can be quickly deployed or restored. |
| Improved Collaboration and Visibility | Teams can better understand and contribute to monitoring practices. |
Monitoring Dashboards
Monitoring dashboards provide a centralized view of key metrics, logs, and alerts across your AWS infrastructure and applications. They help teams quickly identify issues, analyze trends, and make informed decisions.
Customizing Dashboards for Clear Visibility
Dashboards should be tailored to the specific needs and responsibilities of different teams:
- Operations Teams: Real-time monitoring of system health, performance, and availability metrics, with clear indicators of potential issues or breached thresholds.
- Development Teams: Application-level metrics like error rates, response times, and resource utilization for troubleshooting and optimization.
- Security Teams: Security-related metrics such as failed authentication attempts, suspicious network activity, and compliance violations.
- Executive Stakeholders: High-level summaries of key performance indicators (KPIs), service-level agreement (SLA) adherence, and overall system health.
Customizing dashboards for each audience allows teams to quickly access relevant information and focus on their specific areas.
Best Practices for Effective Dashboards
-
Define Clear Objectives: Determine the primary goals and use cases for each dashboard, such as incident response, capacity planning, or performance optimization. This guides the selection and organization of relevant metrics.
-
Prioritize Key Metrics: Identify the most critical metrics that directly impact system health, performance, and user experience. Avoid cluttering dashboards with unnecessary or redundant information.
-
Utilize Visualizations: Use visualization techniques like line graphs, bar charts, and heatmaps to effectively communicate complex data and patterns. Choose visualizations that best represent the underlying data.
-
Implement Alerting and Annotations: Integrate alerting mechanisms to highlight when metrics breach defined thresholds, and use annotations to provide context around significant events or changes.
-
Enable Drill-Down Capabilities: Allow users to drill down into specific metrics or logs for deeper analysis and troubleshooting, enabling a seamless transition from high-level overviews to granular details.
-
Foster Collaboration: Share dashboards across teams and stakeholders, enabling cross-functional visibility and knowledge sharing.
-
Automate and Version Control: Leverage monitoring as code practices to automate the creation and deployment of dashboards, ensuring consistency and enabling version control for tracking changes and rollbacks.
| Best Practice | Description |
|---|---|
| Define Clear Objectives | Determine the primary goals and use cases for each dashboard. |
| Prioritize Key Metrics | Identify the most critical metrics that directly impact system health, performance, and user experience. |
| Utilize Visualizations | Use visualization techniques like line graphs, bar charts, and heatmaps to effectively communicate complex data and patterns. |
| Implement Alerting and Annotations | Integrate alerting mechanisms and use annotations to provide context around significant events or changes. |
| Enable Drill-Down Capabilities | Allow users to drill down into specific metrics or logs for deeper analysis and troubleshooting. |
| Foster Collaboration | Share dashboards across teams and stakeholders, enabling cross-functional visibility and knowledge sharing. |
| Automate and Version Control | Leverage monitoring as code practices to automate the creation and deployment of dashboards, ensuring consistency and enabling version control. |
Simple Monitoring Best Practices for AWS
Effective monitoring is crucial for keeping your AWS infrastructure and applications running smoothly. By following these straightforward practices, you can optimize your monitoring setup, reduce costs, and improve incident response.
Automate and Scale Monitoring
Automation is key for efficient AWS monitoring. Set up automated monitoring solutions that can grow with your infrastructure, like AWS CloudWatch and AWS CloudTrail. This allows you to quickly detect issues and respond promptly, reducing the time to detect and resolve problems.
Set Up Alerts
Proactive alerts are critical for identifying potential issues before they become major problems. Configure alerts to notify teams when anomalies, errors, or performance issues occur. This enables swift action to prevent incidents and minimize downtime.
Plan for Incident Response
Establish clear protocols and steps for responding to and resolving incidents. Define roles and responsibilities, and provide training for teams to ensure efficient incident response.
Encourage Team Collaboration
Promote collaboration between teams for effective monitoring. Share monitoring responsibilities and provide visibility into monitoring data to facilitate knowledge sharing and teamwork.
Optimize Continuously
Regularly review and optimize your monitoring setup to ensure it remains relevant and effective. Analyze monitoring data to identify areas for improvement, and refine your monitoring strategy to meet changing business needs.
Automation and Scaling
| Practice | Description |
|---|---|
| Automate Monitoring | Implement automated monitoring solutions that can scale with your infrastructure. |
| Detect Issues Quickly | Automated monitoring enables quick detection of issues. |
| Respond Promptly | Automated monitoring allows prompt response to issues. |
Proactive Alerting
| Practice | Description |
|---|---|
| Set Up Alerts | Configure alerts to notify teams of anomalies, errors, or performance degradation. |
| Prevent Incidents | Alerts enable swift action to prevent incidents. |
| Minimize Downtime | Alerts help minimize downtime by addressing issues early. |
Incident Response
| Practice | Description |
|---|---|
| Establish Protocols | Define clear protocols and steps for incident response and resolution. |
| Define Roles | Clearly define roles and responsibilities for incident response. |
| Provide Training | Train teams to ensure efficient incident response. |
Team Collaboration
| Practice | Description |
|---|---|
| Share Responsibilities | Share monitoring responsibilities between teams. |
| Provide Visibility | Provide visibility into monitoring data to facilitate knowledge sharing. |
| Encourage Collaboration | Promote collaboration between teams for effective monitoring. |
Continuous Optimization
| Practice | Description |
|---|---|
| Regular Reviews | Regularly review and optimize your monitoring setup. |
| Analyze Data | Analyze monitoring data to identify areas for improvement. |
| Refine Strategy | Refine your monitoring strategy to meet changing business needs. |
Conclusion
Effective monitoring is essential for keeping your AWS infrastructure and applications running smoothly. By following these practices, you can optimize your monitoring setup, reduce costs, and improve incident response:
Automate and Scale Monitoring
- Set up automated monitoring solutions like AWS CloudWatch and AWS CloudTrail that can grow with your infrastructure.
- Automated monitoring allows you to quickly detect issues and respond promptly, reducing the time to resolve problems.
Set Up Alerts
- Configure alerts to notify teams when anomalies, errors, or performance issues occur.
- Alerts enable swift action to prevent incidents and minimize downtime.
Plan for Incident Response
| Practice | Description |
|---|---|
| Establish Protocols | Define clear protocols and steps for responding to and resolving incidents. |
| Define Roles | Clearly define roles and responsibilities for incident response. |
| Provide Training | Train teams to ensure efficient incident response. |
Encourage Team Collaboration
| Practice | Description |
|---|---|
| Share Responsibilities | Share monitoring responsibilities between teams. |
| Provide Visibility | Provide visibility into monitoring data to facilitate knowledge sharing. |
| Promote Collaboration | Encourage collaboration between teams for effective monitoring. |
Optimize Continuously
| Practice | Description |
|---|---|
| Regular Reviews | Regularly review and optimize your monitoring setup. |
| Analyze Data | Analyze monitoring data to identify areas for improvement. |
| Refine Strategy | Refine your monitoring strategy to meet changing business needs. |